Conducting a poll it can be a relatively easy and inexpensive way to obtain meaningful information that can help with decision-making and future planning. If it takes place the online survey (with Google Form or Survey Monkey) the results will be tabulated automatically, but paper surveys must be tabulated to analyze the data. Even if you do the survey yourself, you will have to bear the responsibility of the tabulation of the survey results. The process can be done manually, but using an Excel spreadsheet on a computer is easy, takes less time, and is more efficient at the same time.
Advertisements
Step 1
Open a new sheet in a spreadsheet program such as Excel.
Advertisements
Step 2
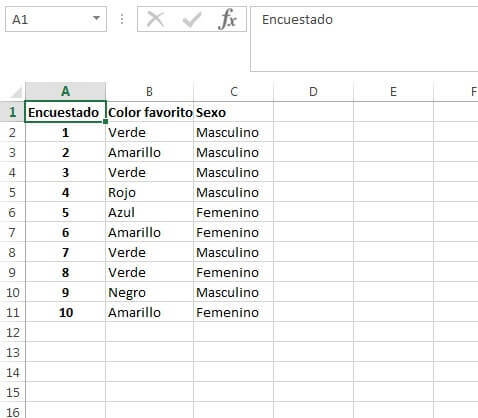
Arrange their rows and columns so that each column represents a question that was asked in the survey and each row will be for the responses given by each individual who responded to the poll.
Advertisements
Step 3
You have to start filling out the form with the information collected in the surveys. For the information to be clean, it may be necessary to put validations in the cells, that is, only select within the given options.
Advertisements
Step 4
Continue with the data entry process until completing the Excel spreadsheet.
Advertisements
Step 5
Finally, the best tool to display the summarized information is to generate a dynamic table with the information from the table.
In evaluating survey results, researchers will often want to compare responses to multiple questions, this process is called multivariate analysis. The most common way to do this is by using the cross tab.
The crosstabulation allows researchers to find correlations between the answers to different questions. It can also be helpful in reviewing customer feedback. For example, a store might find that a large majority of those who are dissatisfied with the store service buys a specific product or worked with a certain employee during the verification. In either case, the store can easily fix the problem.
The presentation of the graphs and data will depend on the objectives of the investigation.
I hope this simple way of tabulate survey data.