The breakeven, is considered an analytical instrument, which companies use to study a variety of elements. It is understood as the level of equality, where the total transactions of the company are in equity with the total values of the company, that is your balance you are where you don't lose any money, but you don't win either. This study helps managers to evaluate detailed information, using prices that are variable and those that remain fixed, which are exposed according to the convenience of the institution and in the same way are taken to increase profits through disposals previously ruled.
Basically the point of balance It is constituted by means of diagrams or graphs which presents the links or correlation of profitability of the different levels of sales, where income covers costs, giving rise to what is considered Balance, in which you do not find the Benefits, but you don't get either losses.
Advertisements
There are ways to calculate the point of balance, but it is important to break down the costs into
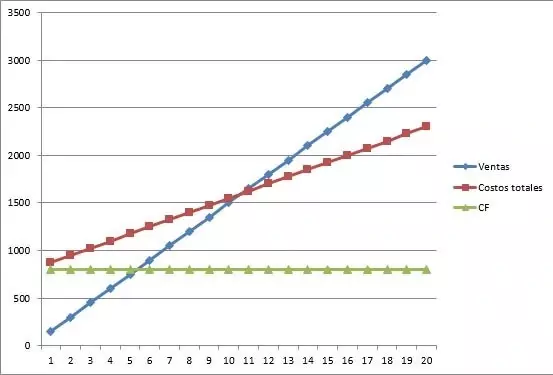
By means of a graph In the image below, the equilibrium point is represented, where on the abscissa or X axis it shows the quantities sold and on the y axis it shows the income (sales).
Advertisements
The fixed values are presented or calculated through the fixed line that crosses the entire graph, since they are taken as neutral or independent of the cost structure.
The total costs in the graph are intercepted with the fixed costs. The transactions are observed from the point of origin or zero, generally in what is called V or line V (sales). To notice the equilibrium point in the graph, we will observe it when two lines collide or cross each other, these lines are represented by the abbreviations CT (total cost) and V. The area on the right represents the profit or potential income in the company and the one on the left shows what can be considered a loss for it.
Advertisements
In this article you will find:
Formulas for calculating the breakeven point
For the calculation, two types of formulas that allow the administrator to determine the called equilibrium point, where you can see if the company is on the right foot for growth or future earnings.
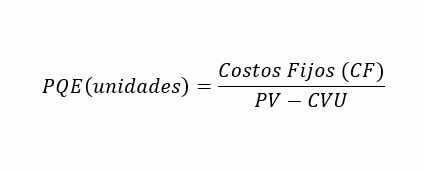
1.- The first formula expresses the amount of products per unit that must be transactional for the organization to be in balance.
Advertisements
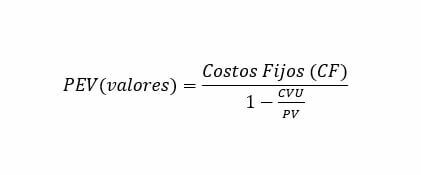
 2.- And the second, like the first, seeks to have equity, but in this case it evaluates how much it is necessary to obtain in monetary values the proceeds of the sales made daily in the institution.
Advertisements
where:
CF: Fixed costs
PV: Product selling price
CVU: Unit Variable Cost
Importance of the equilibrium point calculation.
Companies are always looking to get an idea of their Profits, to evaluate production, the level of purchases made to your merchandise among other aspects; so that they can know the strengths of your institution. In addition to helping to determine the amount of sales that benefit the same with their monetary income, where they cover what was spent in the purchase or creation of the products, plus labor, if any; In other words, with this tool, administrators are able to evaluate the profitability shown by the organization in the market. It is for this reason that this procedure has become of vital importance.
Sometimes if you are a beginner, the calculation will be a bit complex when in reality it is very simple; but with practice they will observe that it is a means that is used both to examine the state in which the institution in profit or loss level to know if it is necessary to sell it to obtain something better.
If you are starting a business and have been with it for a year, it is important to do the Breakeven analysis since it will allow you to observe as a director how it grows or if in the process it is declining due to the maladministration, so that you can implement other works on time that help to grow quickly or make adequate decisions that guide what you put together with effort, such as your organization.
The break-even point graphically
Resolved Balance Point Exercise
Problem Statement:

Answer:
To calculate the equilibrium point we need at least 3 pieces of information. We need the CF (fixed cost), Sales price (PV) and the variable unit cost (CVu)
First we calculate the PV = Revenues / Units sold
HP = 12,000 / 1200
PV = 10
Then the Unit Variable Cost is the (Total Cost - Fixed Cost) / Units sold
CVu = (10,500 - 4,500) / 1,200
CVu = 5
Break-even point in quantity:
Following formula 1 we have:
PEQ (units) = CF / PV - Cvu
PEQ (units) = 4,500 / 10 - 5
PEQ (units) = 900 units
The company must produce and sell 900 units to break even.
Download Excel file with example of the equilibrium point graph:
Balance-point-graph Excel