Discover the easiest way to implement data analysis with a histogram through Excel, the widely known tool in the world.
One of the best programs that we have on our computers is Excel, this has an analysis tool that allows insert histograms in a simple and functional way.
These are used to analyze and create accurate statistics. It is represented by bars, so it is very important to know the procedure involved to avoid confusion with other types of graphs.
Advertisements
Do you want to know how to make a histogram in Excel? Keep reading this post, here we will explain you step by step, simply and without complications.
In this article you will find:
What is a histogram?
A histogram It is a graphical representation of bars that show data about the variables of something specific. The highest part of these columns is where the number of individuals is reflected, which are calculated according to their class or intervals.
Advertisements
The horizontal axis of these columns represents the values of the variables, while the vertical axis reflects the frequency.
How does a histogram work?
In the particular case of Excel, it is important to first create the frequency tableIn this way, it is much easier to collect the data and make it correct. within a histogram this is important to be able to calculate the intervals.
Advertisements
They depend on the data collected and the information to be obtained, in the case of age this can be every 10 years, the which will be represented in columns, and on the other side the number of people to analyze represented in groups of different quantities.
What does it take to make a histogram in Excel?
There are many considerations that must be taken when making a histogram in Excel, one of them is that different data must be provided:
Advertisements
- Class number: which are responsible for representing the intervals that you want to use within the graph.
- Input data: these are directly the data to be analyzed through the histogram process.
In general, having this clear and following the steps that we are going to explain below, it is quite easy to make the graphs and later analyze them.
Steps to make a histogram in Excel
The creation of a histogram is not as complicated as many may think, it is a simple process, it It is important to follow each of the steps as we are going to explain them in this post and to know well the data that is will include.
Advertisements
Previous steps
The first thing to do is check that all the analysis tools are loaded, doing it is very simple:
- Being inside Excel, the Data tab must be opened within the list of options.
- Then within the Analysis group, Data Analysis should appear. If everything is correct, you can simply proceed to make the histogram.
In the event that this option does not appear, they must be charged on their own, and additional steps must be taken.
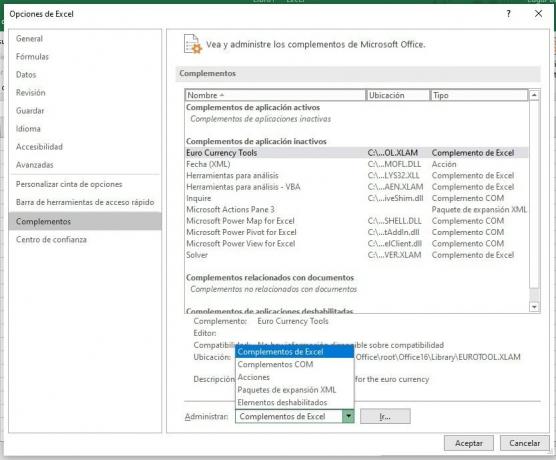
- Enter file.
- Within the menu select Options.
- A box will appear on the screen, where you should click on Plugins.
- Within the box where it says Manage, you must choose the Excel Add-ins option and then click Go.
- A new box will appear on the screen with several options to select, you must choose the Analysis Tools box and then the OK button.

Steps to make a histogram
It is necessary to have the table with the data to be analyzed, a column with the frequencies and another with the intervals. Then we will look for the Histogram function in the tools that we activated earlier. The steps to follow are:
1.- You have to select the data tab, and select the “data analysis” option, a list of alternatives will open, where the histogram will appear.

2.- Then, the data must be selected. In the class range, the data that refer to the frequencies of the intervals are selected. The first cell should be selected and dragged down with the cursor. The cells corresponding to the intervals will be in the input range. The data is numeric only, it should not include the name.

3.- When selecting the data, we proceed to choose in which sheet the histogram will be created, selecting the option in the output options.
Format the chart
At this point, you just need to format it to improve the appearance of the histogram. You can modify the space between columns, choose colors, borders, fills, among others. Changes will depend on the need and preference for each test.
In this way, we can see that the Excel assistant makes it much easier to making a histogram with this tool. Just follow the steps and customize your histogram according to your requirement.