The Gaussian bell refers to a long line of studies, established by various physicists and scholars of antiquity, among which Carl Friedrich Gauss stands out.
Known as the mastermind that would give the final conclusion to the investigations and studies already established by many mathematicians and physicists, until arriving at the famous theory of the Gaussian bell, that is why it is named after him.
Advertisements
It is important to highlight that, to reach the gauss point, this study passed through various hands that contributed their knowledge, starting with the famous mind of Abraham Moivre, who gave a starting point of this theory and also of the line of teachings or logical knowledge to achieve the final results.
That is why various authors give it the name of Moivre- Gauss, giving this other intellect some credit, well deserved for his remarkable contribution.
Advertisements
In this article you will find:
What is the Gaussian bell?
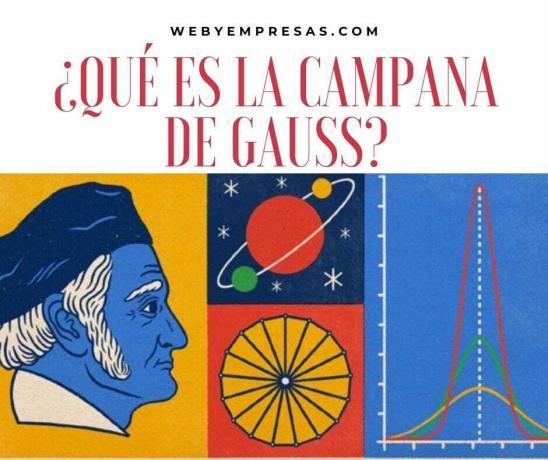
The normal distribution
- It is a graphical representation of the normal distribution, of a group of data, logically and orderly distributed in high, medium and low values, which generates a graph with an appearance of campaign, hence its name.
- Among other peculiarities of said graph, a symmetry is generated with respect to a certain variable.
The aforementioned bell shows the way in which the probability of a continuous variable is distributed, generating a mathematical function in which there are two quantities, one dependent on the other, which are named (Domain and Codomain).
Advertisements
- In the deduction of formulas in the context of the Gaussian bell, we have a continuous variable, which is capable of adopting any value within the framework of an interval already previously established, that is to say that between two fixed values there will always be an intermediate value with a high possibility of being captured as a value by the variable keep going.
In the graphic a concave shape is evidenced in the upper-middle part and with the mean value of the function in its center and at its ends a convex shape and with a posture or tendency that approaches constantly towards the abscissa axis (X axis).
In such a way with this behavior it is possible to know how the values of variables whose changes obey random phenomena or unpredictable, in other words, the most common values have a presence in the center of the bell and the less common are ordered towards the extremes.
Advertisements

Why is it called the Gaussian campaign?
His name is credited in honor of the famous German physicist Carl Friedrich Gauss who was an important mathematician and renowned astronomer.
Gauss formula
According to the relation and deduction obtained from the graph, the following is obtained:
Advertisements
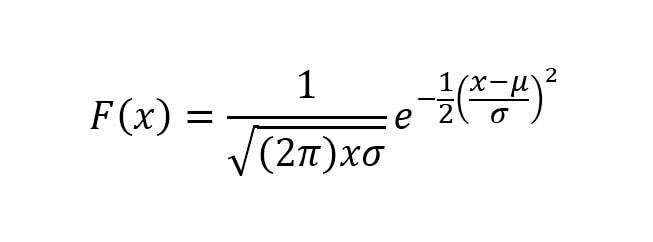
Where:
- μ = Average.
- σ = Standard deviation.
In such a way, the graph with the equation takes into account the following:
- The function considers the mean and the standard deviation.
- It is symmetrical.
- It has a horizontal asymptote.
- The area between the function and the horizontal axis is equal to 1, that is, the entire area under the curve represents 100%.
With it, a probabilistic system can be established to know what is the possibility of a phenomenon occurring framed within known limits, or established by the user himself or the system he wishes to study, thus having the following:

Where:
- n-1 = It is the lower limit of the integral or the beginning of the interval of the established distribution.
- n = It is the upper limit of the integral, or the end of the interval of the established distribution.
History of the Gaussian Bell

Despite being the formal study of various theoretical components over a period of more than 200 years, most of it is credited to the advances made by the German mathematician during the 19th century.
The origin of it dates from the 17th century, but as a fixed theory it is established in the 18th century by the aforementioned Abraham Moivre, who through his enormous capacity for analysis noted that when tossing a coin, he would have the probability of obtaining one of those sides (heads or tails), with which he deduced that in N tosses he had a graphical representation with a smooth curve as N got large, where N represents the indeterminate number of times the coin would be released.
Later he deduced that with the use of said graph an equation would be found that would allow a simpler solution to be given to the calculation carried out. product of the experience lived with the simple toss of a coin to the air, taking advantage of any circumstance of daily life to improve their background.
Part of the story that relates most properly to the subject, resides in a theory created earlier in the 17th century by Galileo that It is called Analysis of measurement errors of a series of astronomical observations made during the work of the famous character.
The existing relationship is given by the conclusive graph that was generated during the studies, which was very similar to the bell Gaussian, whose conclusion implied that errors were symmetric, and that small errors were more frequent than large.
Where is the Gaussian bell theory and function applicable?
The gaussian function established by all the aforementioned is applicable in various contexts and areas of study, among which we can mention the natural sciences, social sciences, mathematics and engineering.
When it comes to probability and statistics, this component appears as the normal distribution, which allows modeling a huge amount of natural, social, psychological and other phenomena, being able to calculate the probability that several values occur within a certain rank
In short, this component covers almost all the study areas, considerably improving the understanding of some phenomena. both natural and non-natural, being able to anticipate events and occurrences in a certain way to establish and create systems prevention, contingency plans for phenomena and even to understand and study the behavior and fluctuation of the stock markets current.