Before exemplify a flow chart Let's define what this diagram is and what it consists of.
In this article you will find:
What is a flow chart and what is it useful for?
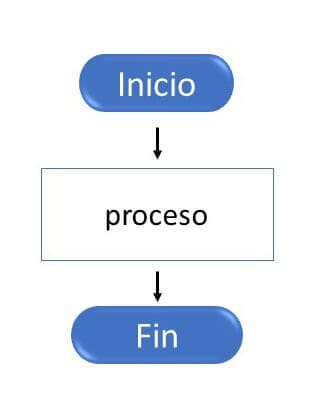
A Flowchart also known as an activity or process diagram, it is a way to graphically represent the sequences of a process with logical steps represented by symbols, whose structure allows to understand the processes of a whole.
Advertisements
Said structure of the diagram must be orderly, clear and with concise information, which allows to interpret the steps of a process in an easy and simple way.
What is the flowchart useful for?, these diagrams are useful in different areas of application where prior organization is required and evaluate different approaches in the activities of a process, as this diagram is very easy and versatile to use, as for example in industrial processes.
Advertisements
Rules required in the flow chart
However, for a flowchart to be well done, it is necessary to comply with certain rules or guidelinesnecessary for the symbolic representation of the process, these rules are:
- Each process symbol must go top to bottom and left to right to explain the chronology of the events.
Advertisements
- The lines or arrowsto be used must be straight, either horizontal or vertical indicating the sequence of events, leading to the activity or the next event.

- All symbolic ones must be connected with lines or arrows, since the arrows are the ones that give meaning to the chronological orientation of the activities represented in each of the symbols.
Advertisements
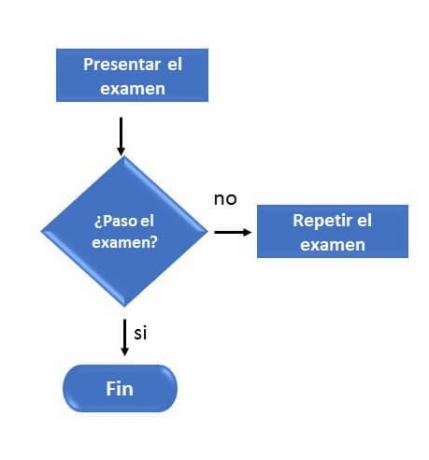
- On decision symbols it may reach you several lines, however, you will only have two decision options “Yes or no, true or false”, this allows the process of graphical interpretation of the questions to be easier.
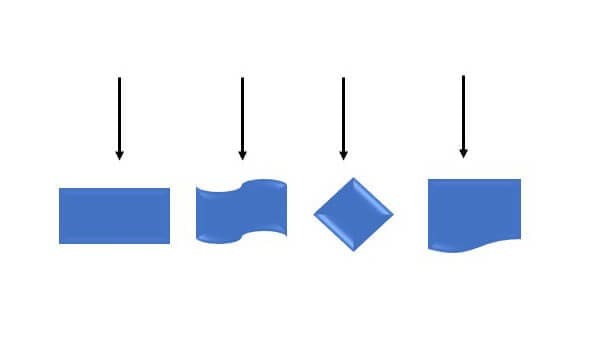
Symbols in a flow chart
In a flow chart, use the correct symbology It is essential for the process to be represented to fulfill its useful purpose and for anyone to interpret it. the function or purpose of each symbol needs to be correctly identified within the diagram.
Advertisements
The symbologies to implement are the following:

These symbologies used in a flowchart are generally the most used or common, but some processes may include other symbols according to the process that you want to represent.
1. Example of a flow chart (bakery)
The flow chart as well explained above is very useful to represent a process in any field of application, In organizations, it allows the production processes to be graphically represented.
In this particular case, an example of how to elaborate a flow chart of a bread producing company.
First, before starting to represent the bread-making process in the flow, we must take into account the following guidelines.
- Define the activities involved in the processIn this case, we will focus on the activities of three stages or departments of a bread producing company.
The diagram can be very detailed or only represent the fundamental activities, everything will depend on the utility that you want to give it and the complexity of the process.
- Choose the symbols according to each activity to represent the processFor this you can use a sheet of paper and make a sketch of the activities and draw the symbol according to each of them.
- Make the process connections, To do this, use lines or arrows that allow representing the continuity of each activity in chronological order.
- Review the sketch and write it down on a sheet of paper or on the computer, Review the process diagram in detail when having the sketch made, so that any detail that prevents the process from being correctly represented can be corrected.
In this example or particular case, three departments of a bread-producing company are represented, we can observe three diagrams of flow, one for each department, in which a circle is used to link three stages that together form a process full.

If the flowchart does not fit on one sheet, the diagram can be finished on another sheet by using symbols representing continuity, without losing the order of continuity of each activity.
However, it is recommended that the diagrams be made if possible on a single sheet or on the fewest number of sheets possible, since larger samples make understanding more difficult.
2. Example of the flow chart (financing)
In this second example we can visualize a horizontal flow diagram, since this type of diagram offers the flexibility of being able to represent the process vertically or horizontally.
In the vertical diagrams the reading or view of the process is done from top to bottom in chronological order as it could be observed in the previous example.
In the horizontal diagrams the chronology of the processes is reflected from right to left, as in this example, in which a horizontal diagram of decision making for the acquisition of financing for a certain project business.
Nevertheless, the same flow chartcan include vertical and horizontal chronological processes In order to detail parts of the process, the important thing is that the sequences of the processes are logical and easy to interpret.

As could be seen in the example, a flow chart can be used to reflect processes of different kinds, not necessarily tangible or palpable processes with the naked eye.
Well this It can be used for any process, from decision making, information systems, production processes, among others.
To do this, it is only necessary to establish a beginning and an end of the sequential order of the process that you want to represent in the flow diagram.
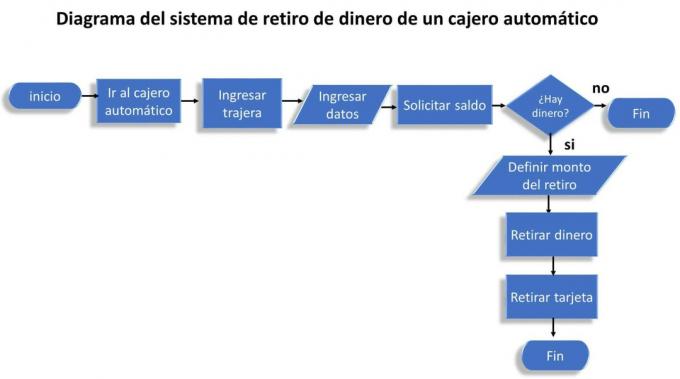
3. Example of a flow chart (daily living)
Flow charts can even be used to represent processes of daily life, as in the following example used to represent the process of withdrawing money from an ATM, in this diagram of Flow can be seen to be integrated within the diagram, horizontal and vertical sequences.
Although a representation was used to represent the process of withdrawing money from an ATM. horizontal and vertical graph to explain the order of events, it can be seen that this is still easy to interpret.
For the elaboration of the diagrams, many resources are not needed, once the process to be represented has been defined, it can be done in pencil on a sheet of paper or through digital resources.
If you want to use digital resources and you already know what symbology to implement you can use offline tools like those offered by Microsoft office, like PowerPoint or even Word, you just need to insert the shapes you need.
Nevertheless, you can also implement web pages that offer free tools to create flowcharts tailored to what you need such as Lucidchart, creately, diagrams.net, among many other options.
Regardless of the tools implemented to develop the flow diagram, the most important thing is to have the activities of the clear and defined process before starting so that the diagram fulfills the functionality of serving as a representative tool of the process.