The UML class diagrams is a type of diagram model within UML (Unified Modeling Language) models, which uses graphical elements as a form of language to describe a system.
In this article you will find:
What is a UML class diagram and what is it useful for?
A UML class diagram is a type of structure diagram within UML diagrams, which allows you to categorize the elements that make up a system and the way in which these elements are related to each other, according to its attributes, qualities and implemented methodologies.
Advertisements
What is the UML class diagram useful for? These class diagrams are very useful for describe attributes of the elements that make up a certain system,achieving amore general view by describing composite data in blocks.
UML class diagrams are usually widely used by engineers to describe the structure of software systems describing the elements present in the software and the method of operation that each element uses.
Advertisements
Fundamental parts of a UML class diagram
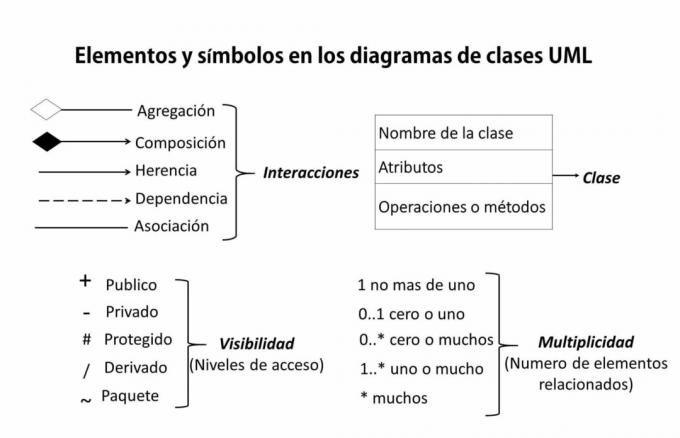
These diagrams are fundamentally characterized by their structure in blocks divided into three sections that are:
- Upper section: In this section the name of each class or element to be classified.
- Middle section: Describe the attributes of the class, specifying specifically their qualities.
- Lower section: It describes the operations or methodology to implement, describing each operation in vertical list mode.
In addition to the sections in each class block the following symbologies are used, as described in the following image to facilitate the compression of these diagrams.
Advertisements
UML class diagram example
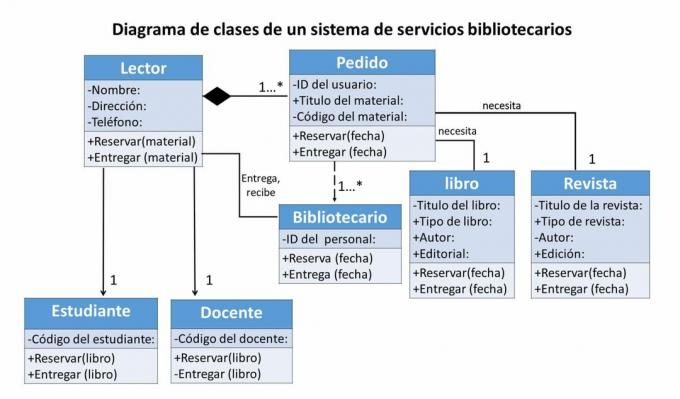
The following diagram shows a practical example of what a UML class diagram would look like to represent the reservation system for library materials, such as books and magazines.
Advertisements
Let's see the following image:
Advertisements
In order to understand this class diagram, in this graph we will explain the classes that represent each block, its attributes, the methodologies implemented and the level of accessibility that the elements of the classes have, breaking them down in the following ways:
- Attributes and methodologies
The attributes and methodologies implemented described in list or item form, detailing each description one below the other.
The attributes are described in the middle section in a very concrete way and in the lower sectionthe methodologies, in which in this case the classes use a reservation and delivery system as a method to access the material.
- Visibility
The visibility represents the attributes and methodologieswhat they can have in commonthe classes or just be conditions of each class.
When a condition is specific to each class, said item is represented by the negative sign which represents that this is private and common conditionswith other classes are represented with the positive sign, symbolizing that it is public.
In the case of the dates to reserve and deliver the book or magazine, it is information that is shared in different classes, that is why it is represented with the positive sign.
In this same context, the personal information of each reader is unique and is not shared with more classes to accept the reader type, because in this case the classes that represent the student or teacher are subclasses, which makes it unnecessary to spread out the identifying data, since these subclasses inherit the data from the main class.
In addition to the internal elements of each class, there are also external elements that allow us to understand the relationships that exist between different classes, to understand these external factors let's look at the following example.
Class diagram example
The following class diagram represents a customer service system for reserving rental vehicles.

As visualized in the diagram, each class is connected by lines or arrows representing the interactions between classes and sequences in the system, are also displayed next to the arrows or lines numbers that indicate the multiplicity of the elements of the classes.
To understand these factors external to each class Let's break down the diagram as follows:
- Interactions:
Interactions are lines and arrows used to represent the way each class is related to another class, asking in the same diagram to find different types of interactions, as in this case.
The diagram shows a horizontal linewhat the association represents what's up between the car rental agency and the client to carry out the economic exchange.
However, for the transaction to be possible customer service is essential, the transaction depends on that customer service therefore it is represented by a flashing arrow.
The next arrows are those that come from the client to the reservation and from the reservation to the payment, in these cases the arrows at one end they have a black rhombus shape, these arrows represent composition.
These compositions indicate basically that the reservation is made up of the client and that in turn the payment is made up of the reservation, since, If the client does not exist, the reservation and payment would not be possible.
- Multiplicity:
As for multiplicity, these represent the quantityof elements that is related between classes.
In this case the company can be related to one or many clients (1… *), but agency policies allow clients to make a reservation of only one car (1) at a time, Regarding the payment method, the customer is allowed to make a single payment or split the fee into several payments (1… *).
In this way, the number by itself represents an exact amount, however by adding the three ellipsis and the asterisk to it, it is implied that there may be a minimum number of related items of one (1), but there is no maximum amount defined, being the asterisk (*) indicator of many.