This Ishikawa diagram is also known as cause and effect diagram, diagram grandal or fishtail diagram due to its shape.
In this article you will find:
What is the Ishikawa diagram and what is its usefulness?
The Ishikawa diagram is a graphic representation that allows to represent a problem and its possible causes, employing a structure in the form of fishbones, in which the thorn o horizontal center line represents the problem or the effect and side lines represent causes probable.
Advertisements
What is the Ishikawa diagram useful for? this diagram is a very useful tool to visualize the possible roots in a general way that cause a certain problem or effect, allowing in a simple and clear way to visualize the different probabilities.
In this way, different options are taken into account without any possible cause being overlooked or dismissed.
Advertisements
These hypotheses of the possible causes of the problem are studied, thus allowing to solve the problem or at least determine the specific cause.
However, the Ishikawa diagram only limits itself to graphically representing causes and effects, but not the process leading to the problem nor the possible solutions.
Advertisements
Ishikawa diagram structure
The Ishikawa diagram, also known as the fishtail, is structured based on the following elements:
- Head: represented the problem from which the central spine starts.
- Central spine: made up of the categories that cause the problem represented by a horizontal line.
- Minor spines: used to represent subdivisions of minor problem or cause.
How to make an Ishikawa diagram
Making an Ishikawa diagram is very easy and simple, for this it is necessary to follow the following steps:
Advertisements
- Define the problem or the effect you want to study.
- Draw a line or arrow horizontally and at the extreme left write the name of the problem or effect, precisely.
- Make a brainstorm aboutpossible causes and break them down into categories, each category represents a sloping vertical line in the opposite direction to the extreme of the problem.
- The most probable categories or causes are placed according to the order of probability of being the cause of the problem.
- Within each category sub categories or secondary causes are defined of the problem and to respect them, a lateral line is drawn that follows from the vertical lines.
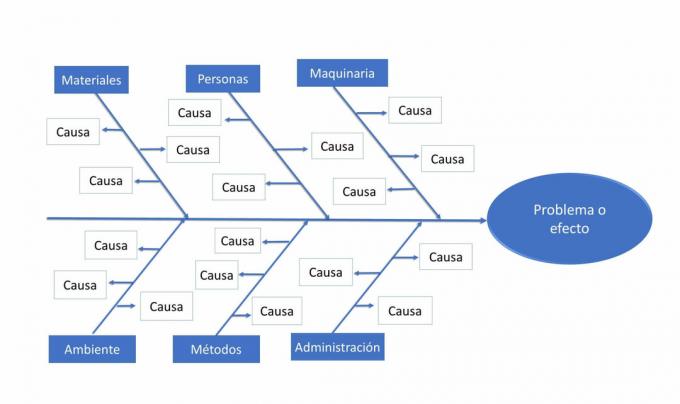
These Ishikawa diagrams are generally constructed from five categories: the environment, the human factor, the methodology, machinery and materials implemented, modifying according to the conditions of the problem you want represent.
However, these categories are not a rule, but a model to follow that can be used to develop the Ishikawa diagram; as it can be seen in the following graph:
Advertisements
Ishikawa Diagram Examples
Example 1: Production delay of a factory
In order to understand the Ishikawa diagram first It must be based on an existing problem and the possible causes not determined, but that are directly or indirectly related to the problem.
In this case there is a problem of delay in the production of a certain product in which In this case, different hypotheses are raised about the possible causes that ask to cause said inefficiency.
To do this, a prior analysis must be done that allows to identify each one of the variables that cause the problem.
Once identified each variable that can cause the problem we proceed to draw the lines of the Ishikawa diagram.
Let's look at the following diagram:

As can be seen, the delay in production can be due to multiple factors, factors that through the diagram of Ishikawa can be visualized in a general way, which facilitates the analysis of the possible hypotheses of the causes of the trouble.
Example 2: Extinction of animals
These diagrams that are characterized by their particular shape of fish vertebrae can be applied to represent problems and causes regardless of the nature of the problem.
Although the analysis of each probable cause cannot be represented, if it can be represented in the graph the order of causes according to the level of probability of being the main cause of the problem.
Let's see the following diagram in which the causes of the problems of the extinction of animals due to human effects, climate change, possible diseases and other causes species.
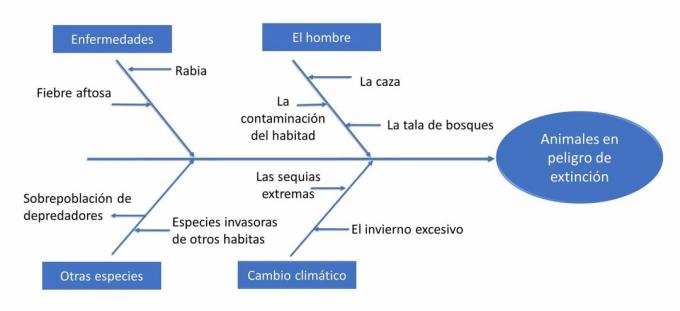
More specific causes are derived from each category, although there may be many causes, for the purposes of the example only a few are raised.
As can be seen, the categories can be modified according to the conditions or qualities of the problem that need to be represented.
Example 3: Poor school performance
These diagrams for their simplicity can be made freehand on a sheet of paper, although to make it more practical it isrecommended to develop them in digital tools such as Office PowerPoint, Word or online programs.

So how can it be observed in the graph about the possible causes that can cause poor school performance, these categories there do not necessarily have to be the same number of categories on both sides of the center line, since these will depend on the magnitude of the causes of the problem and how they can be categorized.
Example 4: Ishikawa diagram
Although some problems tend to have diverse and complex causes, they can still be represented in Ishikawa diagrams.
Some causes may comprise within themselves different variants that may cause the problem; in these cases a cause can be represented in several subdivisions as possible, to visually understand where the cause stems from.

For your understanding, let's see the image of what a graphical representation of these cases would look like in the Ishikawa diagram.
In this diagram it can be seen that within categories (1 and 4) there are divisions that in turn are subdivided into others, these diagrams are ideal for representing these variations within a sub-category of a cause.