As in any organization, the control of the processes of a certain system is of vital importance for the perfect functioning of the same, that is where the role of the block diagram takes an important role for the interpretation of the process graphically.
In this article you will find:
What is a block diagram and what is it useful for?
The block diagram is a graphical representation that allows to represent the internal functioning process of a system through the use of block-shaped elements to represent the operation of each phase of the system connected with lines or arrows.
Advertisements
What are block diagrams useful for? these block diagrams are useful in different fields of application, where it is required to design, interpret and simplify processes of a system, exemplifying the directions and flows of information and matter that entails one process to another.
It is especially useful in the field of engineering, in industrial processes, in computer systems, among other fields of application where processes tend to be complex.
Advertisements
Nevertheless, to make these block diagrams they can useMicrosoft Office tools like PowerPoint or even web tools like Lucidchard.
Examples of block diagrams
Example 1: Operation of a blender
In this case we are going to represent in a simple way the internal operating system of a blender, its inputs and outputs by means of a block diagram.
Advertisements

Advertisements
This diagram represents the electrical energy input to the appliance, which in this case is a blender, Each element or part of the system is represented as follows:
- The flow ofEnergy represented with blue arrows.
- The matter used is represented by arrows in black.
- Intermittent lines in black color that symbolize the flow of information.
- Each process or element of the system is represented by rectangles or blue blocks.
- As a last element the circumference with two signs, the positive and negative that represent the power flow switch.
Once each element has been identified, the system can be interpreted and analyzed internal operation of a blender, in which the flow of electrical energy enters the motor, reaches the blades and produces or leaves it mechanical energy.
Advertisements
When the motor and the blades are running, the raw material (water and fruit) are poured, from which a product comes out finished that is the liquefied, but in turn also generates heat and sound energy, product of the operation of the system internal.
After the process has finished, the block diagram implies by the flashing lines, information about the process that the operator performs when disconnecting the electrical power flow from the appliance.
Example 2: Block diagram of a bicycle
Part fundamental for making and interpreting block diagrams, it is the use of lines and dates to describe the process, because in block diagrams up to three different types of arrows will be implemented, since each one represents a different condition that needs to be differentiated to be able to interpret the system or process easily.
In this case, a system of inner workings of a bicycle, in which for its operation a mechanical mechanism.

The mechanical operation of a bicycle isoperated through a driver He rides and decides how fast he wants to go, when to brake, and when to shift so that the bike is heading in the direction he wants.
However, this process is not performed on the bicycle by itself as part of its system, since it does not have the ability to function without the operator, being the driver who maneuvers it and supplies the information for its functioning.
This process in the diagram is represented with flashing lines that represent the provision of information necessary to maneuver the bicycle.
As for the mechanical mechanism, this through its parts works like a gear, represented as can be seen in the image with blue lines, which Mechanical energy is sent through the pedals to the transmission and in turn to the rear wheel, in the same way that same energy is transmitted to the wheel lead.
Example 3: Communication systems
In this case, the use of the block diagrams in communication systems, for the transmission of a message.
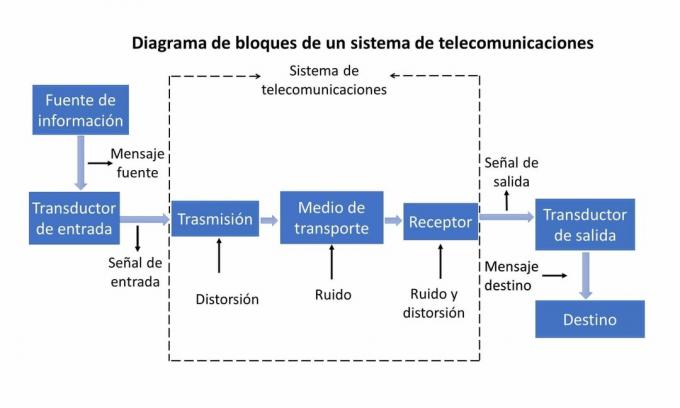
In every process of a telecommunications system, it is sought to transmit a message from a certain source to another that is the destination, whose process is described in the graph of the diagram.
This block diagram represents the process that involves generating a message through electrical signals, that reaches a transducer device and transform that signal into waves integrated by noise and distortion thus generating the sound, being these transducers, microphones or video cameras among others devices.
Those same waves are adapted to a transmission mechanism and the medium by which the message is transported as waves. electromagnetic or optical fiber, which reaches the transducer of the receiver and adapts the message to the device of the receiver.
Example 4: Ethyl Alcohol Processing Internals System
In the following block diagram you can see a ethyl alcohol processing inner workings system.
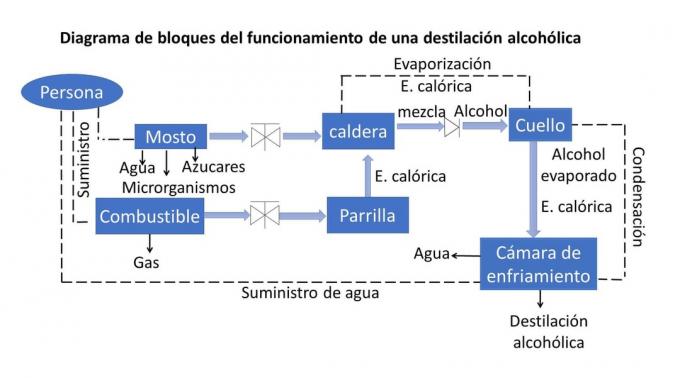
Operation begins with the natural chemical process that converts cane sugar, water, and living microorganisms such as leavers, in a fermentation process called must to produce alcohol.
However, to separate and filter the alcohol an operator is required, a person who pours the wort into the boiler and in turn passes gas to supply fire to the grill that will cook the wort.
That cooking process in the boiler generates the evaporation of alcohol that is filtered in the neck of the alembic and reaches a cooling chamber that when supplying water to the pipe cools it and generates a process of condensation that converts alcohol vapor in distilled liquid alcohol.