The flowcharts they have become an excellent tool to represent complex processes in a much simpler way, regardless of the area of application and the complexity of the process; such is the case of geometry, to calculate the area of a triangle.

Advertisements
Although their determination requires mathematical calculations, these calculations represent procedures through a series of steps, starting from the data of the base and the height of said triangle.
Once the necessary data has been obtained and the mathematical procedure has been applied, we proceed to outline the flow chart.
Advertisements
To understand how we can use flowcharts to calculate the area of a triangle, let's first define some basic concepts and then represent the step by step of its elaboration through a practical example.
In this article you will find:
What is a flowchart?
A flowchart is a graphic representationused to easily outline a process or cycle of activities, making use of algorithms to represent said process, for this, it uses geometric shapes arranged in a schematic way.
Advertisements
Basically, flowcharts are a tool that allow graphically showing how a process works, through the use of a previously defined symbology.
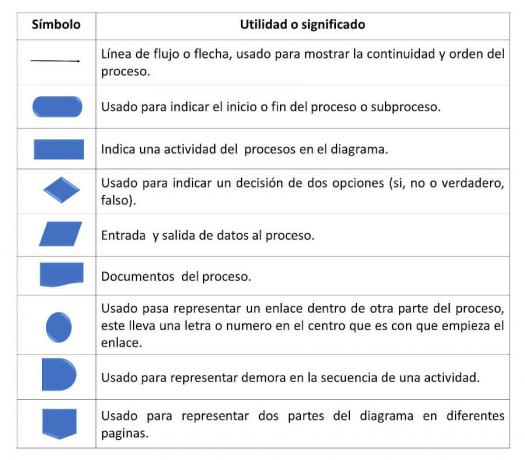
Symbology to be used in the flowchart?
Regardless of the process that we need to represent, it is necessary to comply with the correct symbology, to make sense of the process in the diagram, these symbols are:
Advertisements
If you want to know more in detail how to implement the correct symbology in flowcharts, follow us at the following link, doing click here.
Advertisements
What is it and how to calculate the area of a triangle?
The area of a triangle is the measure they have a surface, delimited by the three sides that said triangle has, therefore, the length of the base and its height, are determining factors for the calculation of its area, which I knowexpressed in square units; for example, cm².
To calculate the area of a triangle, multiply the base (b) by the height (h), then divide the result by two, with the formula:
Area of a triangle= base (b) x height (h)/ 2.
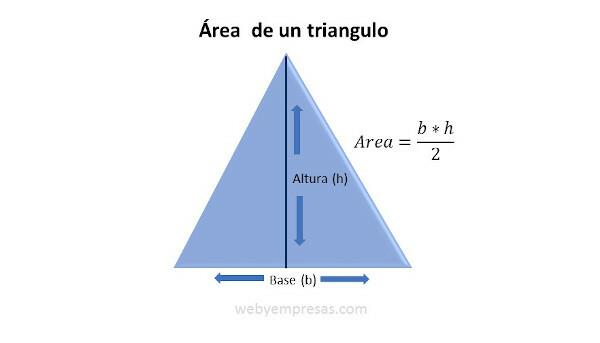
Assuming that we have a triangle whose height is 8 cm, and the base is 6 cm, substituting the formula, the area of the triangle would be= (6×8) /2= 24 cm²
Steps by Step of the use of the flowchart to represent the calculation of the area of a triangle
represent the calculate the area of a triangle using the flowchart It is very simple, because, like all flowcharts, its structure will depend on the process itself that you want to represent.
In this case, the steps would be as follows:
Step 1:
Step one consists of previously have theresolved exercise, based on the data of the height and base of the triangle, and applying a simple formula: Area of a triangle= base (b) x height (h)/ 2.
Step 2:
Outline the process of calculating the area of the triangle in an orderly and simple way, in such a way that it is easy to understand, for this, we can help ourselves with paper and pencil through a draft or sketch.
Step 3:
Once the scheme of the calculation process has been defined, we proceed to identify symbology to use for our flowchart.
Step 4:
To make sense of the flowchart and represent the process of calculating the area of the triangle, we place the corresponding symbol (geometric shape) and on it a very short keyword that identifies the activity within said calculation process, then we unite the symbols, by means of arrows and that's it.

The diagram to represent the calculation of the area of a triangle or any other process, we can easily do it in PowerPoint, Excel and even online platforms; but, if none of these options is available to you, you can still do it in your notebook and add color to the shapes to make it look much more striking, you just have to take into account the symbology to use.
If you are interested in learning how to make flowcharts in an easy and detailed way, here at webyempresas you will find the following articles that may interest you:
Articles of interest:
- What is a flowchart and how to do it.
- Symbology to use in a flowchart.
- Flow Chart Examples.
- How to Make a Flowchart in Excel.
- How to Make a Flowchart in PowerPoint.