A PERT diagram is a very useful graphic tool for project management, since it allows determining the execution times and calculating the slack time and the critical path of each project process or activity, that is, the time in which they can be executed without compromising the subsequent stages or the final delivery of the project.
The PERT charts They're a management tool that makes it easier for project managers or organizers to schedule and organize activities for their execution efficiently.
In this article you will find:
What is a PERT chart and what is it useful for?
This PERT chart is a planning toolit's based onanalyze the dependencies between the activities of a project, allowing to specify the time How long does it take to complete each activity before continuing with the next one?
Advertisements
What is a PERT chart useful for? This diagram allows in a schematic way to represent the execution of a project, which helps both the organizer and the work team to optimize the time and
It is especially useful for carrying out projects that have many dependencies on the activities to be carried out and that have very limited delivery times, such as construction projects and real estate remodeling.
Advertisements
How to draw a PERT chart
Developing a PERT diagram, although it seems a complex process, its development can be easy considering the following steps:
- Define the project and identify each activity to run.
- identify the sequences and dependencies between activities.
- Represent in a schematic way the activities in the project execution process.
- Create a schedule defining the execution times of each task.
- Management and control of the project based on the structure of the times established in the diagram.
However, for its preparation it is necessary to know the following elements and symbols:
Advertisements
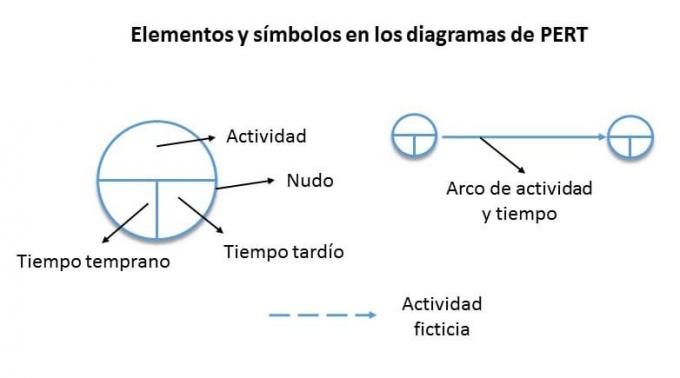
Once the activities to be represented in the diagram and the sequence in which they will be carried out have been identified, what follows is determine the early and late execution times allowed for each activity of the project.
Advertisements
To understand the process of making this PERT chart, let's look at the following examples.
1. PERT chart example:
Although these diagrams are especially useful to represent the execution time of projects, it can be used in any process where it is required to know exactly the time it takes to execute a process.
Advertisements
For practical purposes and easy interpretation how to draw a pert chart we will take as a reference the process of decorating a cakeFor this we will use the following data:

It's important to put attention on time must always be expressed in the same unit of measurement, that is, if they are minutes, all activities must be expressed in minutes.

- Iceberg time calculation:
You always start calculating the time early, in an order that goes from right to left and from top to bottom, we use the first node as a reference, therefore, the time expressed in it is always zero.
For calculating, we addthe early time of the previous node plus the arc time of the activity to calculate, for example, at node 4 (1+15=16).
However, when we want to calculate the early time of an activity that is preceded by two activities, the iceberg time of the previous activity that implies a greater time; For example, in node 5 they precede it as early time (16 and 6), but 16 is taken into account (16+4=20).
Successively, we continue adding each of the activities in the same order until the last one is completed.
- Calculation of late time:
For late time calculation subtract from left to right and top to bottom, that is, from the last activity to be executed to the first.
We start the calculationstarting from the last knot, in which, the late time of that node is equal to the early time.
For further calculation we subtract the late time of the previous node from the arc time of the node to be calculated, remembering that the calculation is done from left to right.
However, for the calculation of the late time in a node in which two activities precede it, the one that involves the shortest time, for example, in the start node it is preceded by (1 and 19), however, 1 is taken as reference (1-1=0).
- Slack time calculation:
The slack time represents the rank of time in which an activity can be performed without compromising or delaying runtime scheduled for other activities.
For calculation only we subtract from the late time the early time in each of the nodes, (T2-T1=).
- Critical route:
Once the PERT diagram is finished, identifying the critical path is essential, this allows to identify those activities that need to be executed in a very precise time frame, hence any delay in them they can waste time scheduling for the other activities.
That being said, critical paths represent the nodes in which in the slack time equation the result is equal to zero.
2. PERT chart example:
For this example we will take a real estate construction project as a reference, for this we represent the data in the following table:
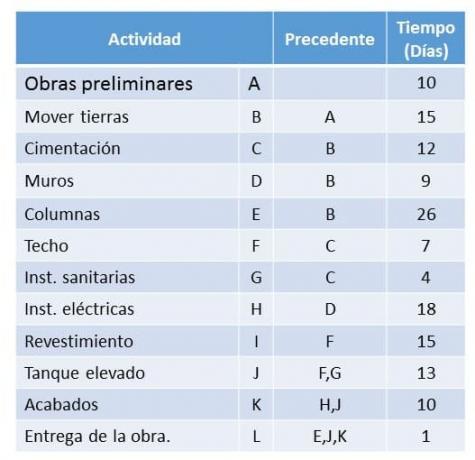
Once the activities have been established, we identify the precedences, this in order to know what activity they need to be completely ready to continue with the sequence of the work, Likewise, the time for each phase of the process must be determined.
Next, we only have to represent the data in the PERT diagram to calculate the time iceberg and late in the activities of the work, in this case the unit of time is expressed in days.
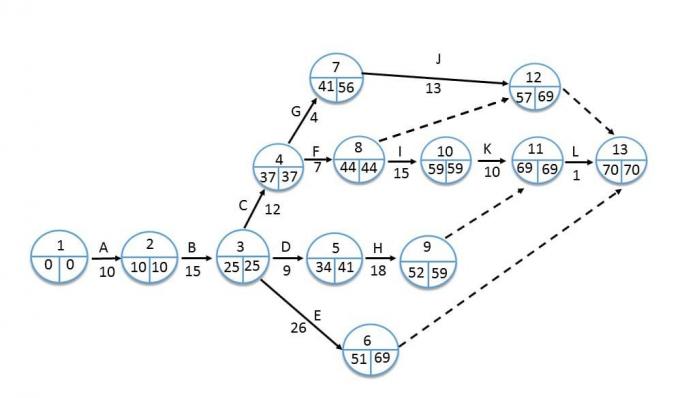
As can be seen, this process at first glance seems complex, but the time calculation process is the same as in the previous example, it should only be taken into account that the calculation of the early time begins until it ends with the last knot and Then, for the calculation of the late time, start from left to right, that is to say, from the last knot to the first.
Once the diagram is finished, we only have to identify the slack time and the critical path.