Financial analysis methods are tools used to evaluate the financial statements of an economic entity, offering a detailed view of the operational efficiency, profitability, liquidity and financial stability of the company, in order to help make informed decisions and project its future financial.
Financial analysis is a crucial component in business decision making, which is based on the application of methods and techniques to measure the financial health of a company, such as its solvency, liquidity, borrowing capacity, performance, profitability, and even its operational efficiency, as a result of its economic activity and financial.

Advertisements
These methods of financial analysis allow simplifying and breaking down the numerical and descriptive data of the financial statements of one or more exercises in order to help business leaders make informed decisions, reducing uncertainty rates.
There are various tools and methods that canhelp business leaders understand the financial health of their organization and adequately plan the direction and future of the company.
Advertisements
Therefore, financial analysis methods are integral elements within the financial management processes; Let's see what are basic methods of financial analysis.
In this article you will find:
What are financial analysis methods?
The methods of financial analysis are the techniques used to understand the financial statements of a company and extract valuable information for informed decision making; These allow evaluating the financial performance of a company, its financial stability, as well as its profitability and growth.
Advertisements
In this sense, Ortiz, Soto (2017) state that "In order to determine the economic structure of a company, it is necessary to use different methods that allow knowing its accounting figures and its behavior, The three most widely used financial evaluation methods are: horizontal analysis, vertical analysis and financial ratios. (p. 103).
Most common financial analysis methods
The most common financial analysis methods are:
Advertisements
Vertical financial analysis method
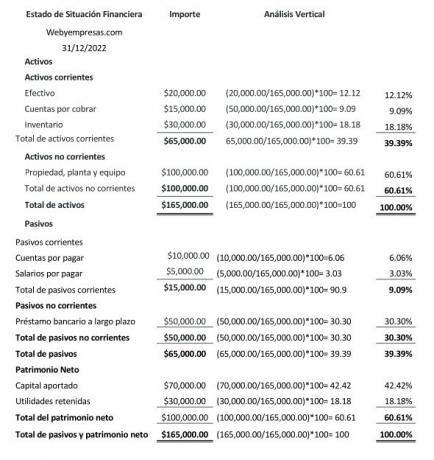
Vertical analysis is a static method, which reflects financial data of a given date or period, and is carried out to analyze the participation percentage of each of the accounts within a financial statement (balance sheet, income statement).
In the balance sheet or statement of financial position, the vertical analysis allows determining the weight of the active and passive accounts, as part of the net worth of the company; Regarding the income statement, the vertical analysis allows determining the percentage weight of an income and expense account in the income statement.
Advertisements
This vertical analysis is a valuable tool that allows:
- Understand the financial structure of the company.
- Know the relevance that each account has within the financial statement.
- Identify possible changes in accounting items.
- Establish policies to make adjustments in expenses, income, liabilities and assets.
- Project and plan a more optimal structure to improve the profit margins of the company.
Vertical analysis formula:
Vertical Analysis = value of the subaccount ÷ the value of the main account = x 100, to obtain the percentage of participation.

Horizontal financial analysis method
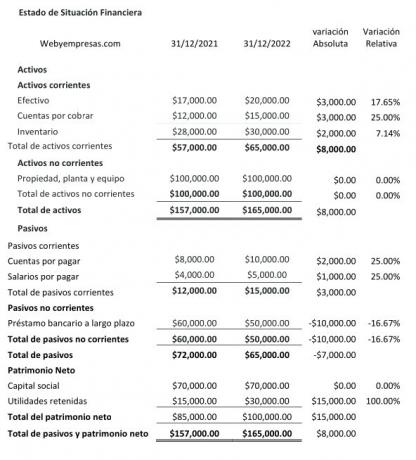
He horizontal analysis is characterized by being dynamic, since reflects financial information from different dates or periodsyes, to compare and analyze absolute and relative variation suffered by the accounts of the different items that make up the financial statements.
The horizontal analysis, by reflecting the variations in the accounts of the items of the financial statements of from period to period, it helps to analyze the causes of these variations and how they may impact the finances of the company.
Usually very useful to evaluate the operational efficiency of the company to manage its resources, to assess whether the growth goals set by the company have been achieved and make new projections.
To calculate the absolute variation, the value of period 1 is subtracted from period 2; Next, to calculate the relative variation, divide the value of period 1 by the value of period 2, subtract 1, and then multiply by 100.

Financial Ratios Method
This method involves the calculation of several financial reasons or ratios, including liquidity, profitability, indebtedness ratios, etc., using data from the financial statements (balance sheet and income statement) to provide a clear view of how the company is performing in several key areas.
Some of the most important are:
- liquidity ratios.
- Management or activity reasons.
- Reasons for indebtedness.
- Profitability reasons.
Liquidity reasons:
reflects the payment capacity that a company has to meet its short-term obligations, taking into account that liquidity is the ability of the company to meet its immediate obligations.
Among this group we can find the following indicators:
- current reason: Current assets / Current liabilities.
- quick reason: Current assets- Inventory/ Current liabilities.
- Net working capital: Current assets-Current liabilities
Reasons for activity:
It reflects the ability of the company to efficiently use its assets to carry out its daily activities.
Among this group of indicators are the following:
- Accounts Receivable Turnover: Credit Sales/Average Accounts Receivable.
- Average collection period: 365 days/ Rotation of accounts receivable.
- Inventory Turnover: Cost of Sales / Average Inventory.
- Average Age of Inventories: 365 days/ inventory rotation.
- Average Operational Cycle: Avg. Period collection + average age Inventory/ 2.
- Turnover of Total Assets: Sales revenue / Total assets x 100.
Reasons for indebtedness:
Also known as ratio of leverage, reflects the levels of debt that the company has with third parties in relation to its equity, that is, how committed are the assets with creditors and suppliers.
Among this group of indicators are:
- Debt Level: Liabilities / Total assets x 100.
- Debt/equity level: Liabilities / Total Equity x 100.
Profitability reasons:
These are used for measure the efficiency with which the company generates profits in relation to the sales of a period, samples, the higher the value of this indicator, the greater the benefits.
Among this group are the following indicators:
- Gross margin: Gross profit on sales / Revenue (sales) x 100.
- Net profit margin ratio: Profit for the year / Income (sales) x 100.
Conclusion:
Financial analysis is an essential tool for decision-making in any company, since it allows managers, Investors and other interested parties assess the current economic situation of an organization, and project its future performance.
Because financial analysis provides a detailed view of operational efficiency, profitability, liquidity and financial stability of a company, and contributes to making more informed decisions and effective.
Bibliographic references
Fajardo Mercedes, Soto Carlos (REDES 2017 Collection). Business Financial Management. UTMACH editions. Machala-Ecuador. 183 p. 22X19cm ISBN: 978-9942-24-110-8.


