A Organization chart also know as organizational chart or hierarchy chart, is a scheme that is used to organize a company, activity or entity. In the same way, it can be used to be able to name the graphical representation of the operations that are carried out in a certain industrial and computer process.
Allows to analyze the internal structure and show the information of the represented company, offering important data on its characteristics in general terms. Within this graphic format, the names of the people in each department and their hierarchical relationship within the entity are included.
Advertisements
Each employee and the position he represents, is mostly identified with rectangles or some other figure. The lines are in charge of relating the levels, which allows a fully clear visual representation of the hierarchy and category of each employee, the jobs and departments that make up the company.
The important thing is not to exaggerate the details, since its purpose is to convey information that is easy to understand and also simple to use.
Advertisements
In this article you will find:
Organizational structure Organization chart
This structure is totally fundamental in companies, this is due to the way in which its characteristics are going to be organized. It is the division of all the activities of an entity that are grouped to form areas and establish hierarchies, which through the organization try to achieve its objectives.
Advertisements

Companies should use the Organizational structure, where all the activities that it intends to carry out are included, through an adequate structure that allows manage their functions and each department in order to produce their products or services in an orderly manner to achieve goals.
Advertisements
This structure can be classified into two parts:
Formal organizational structure
This is very necessary, to be able to divide the various activities within the entity and thus be able to achieve the goals through a Organization chart and in the same way the interaction of its principles that include job classification, responsibility, unity of command, authority, delegation, hierarchy, command equity and control, among others.
Advertisements
Informal organizational structure
It originates from the formal structure, because from there begins the formation of the various structures that are related between the participants and the different factors. This is governed by a social order and they are also more dynamic, since it is integrated through relationships between people who end up forming publicly represented groups.
How to make an organization chart?
It's about a graphic scheme, related to the organized structure of a company and its relationship with the various departments that comprise it. By means of this scheme, the different levels of hierarchy and the corresponding channels can be defined in order to maintain adequate internal communication.
To do it effectively, so that it is properly adapted to the needs of the company, it is necessary to take into account the following aspects:
- It is essential that the organization chart provides all the information regarding the relationships and functions of each of the members, therefore Therefore, the relationship that exists between the departments should be clearly reflected in the graph and in the same way determine the performance of each competitor.
- A scheme must be developed that represents an updated present and in the same way focuses on the future, making clear the studies of what the projection of the institution will be like.
- At the time that the design is carried out, it is important to have the guide of the institutional archives, of all the employees, the relationship between the departments and of course the work performed by each member of the institution.
When plotting, the following recommendations should also be considered:
- The boxes must be rectangular.
- The union of the lines has to be drawn vertically above the middle part and on top of the other squares.
- The horizontal lines indicate the correlation.
- The schema has to be precise when delimiting the units and dependencies.
- The writing of the names of the units and departments must be transcribed correctly.
- All lines must be made of the same thickness.
- If acronyms are used, it is necessary to indicate the full name in the footer of the scheme.
- Adequate space must be left between each of the squares, so that the structure can be seen clearly and the structure can be easily understood.
- In case the company offers consultancies or some coordination, it can be indicated with lines of Points and squares must be placed horizontally from the hierarchical level they are in. related.
- It is important to avoid connecting the squares with the arrows.
- Departments dependent on a single supervisor must be directly linked by a single line.
Tools to create an organization chart
It is very important to know the usefulness of some elements in order to make a well-organized scheme:
Office tools
Since computers are mostly computers that contain the Microsoft Office Pack, you can easily use some of its elements in a simple way, among them are:
1. Powerpoint
It is a fairly simple tool to use, among Microsoft presentations. Contains text boxes that can be related to connectors that are available in the AutoFormat. With this, the schemes can be made quickly, the shapes and also the colors can be customized.
2. Publisher
This tool bears a great resemblance to the previous one, however, its specialty is designing documents, therefore, it is much more accurate.
Online tools
Many of these are totally free, some of them are:
1. Creately
Provides the facility to create various diagrams without having to do any registration. You can only access a desktop similar to the one installed on the PC. With this element you can make forms where you can write, connect them and everything that is needed to develop the document.
2. Cogmap
It is a specialized tool for drawing diagrams. To be able to use it, you need to register, but in case you want to try it first to know how works, you can make a public document that later anyone can see it and even modify it.
Organization of a company
This consists of graphically representing the structure of a certain company, where they are represented all its employees, the structures classified by departments, the hierarchical levels within Of the same.

An excellent organization is essential for a company to be successful. Within this scheme, the definition of the roles and responsibilities of each of the members that is part of the structure must be very clear.
Examples of organization charts
As already mentioned above, these diagrams represent a particular organization of a company, in order to express the main characteristics of it. They can be classified in different ways, depending on their structure, content or according to the purpose they have.
In these schemes, the various areas of activity, levels and hierarchical relationships that are established in it are basically expressed. You can also include the names of people who hold different positions, together with their main activities.
Among the most outstanding examples are:
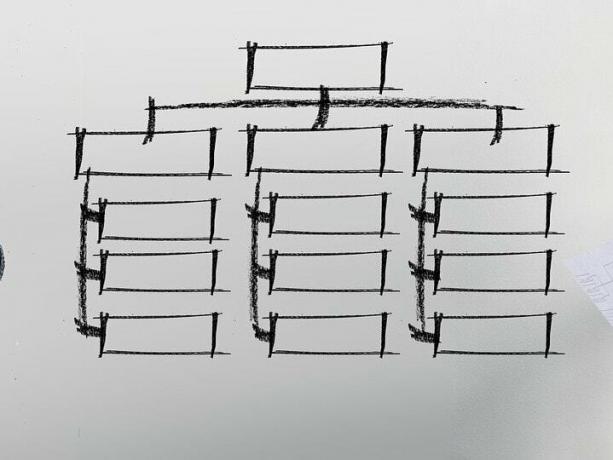
Vertical
The first thing that is placed is the title at the top and then the various hierarchical levels are shown in the form of a pyramid, from top to bottom.
Horizontal
In these diagrams, the title is entered on the left side and from there, all the functions are displayed to the right. Each hierarchy is placed through columns and areas starting from the rows.
Mixed
It is the combination between the vertical and horizontal shape, therefore, the elements are represented much more widely than in the previous styles.
Circulars
Here the position of highest authority should be placed in the center of the graph and around it the concentric circles where the hierarchical levels appear in a decreasing way. The existing links within the scheme will be represented by lines.
Of positions, squares or units
In this case, the scheme represents each of the institution's employees, that is, the number of places, the necessary positions and the number of people that make up each of the places.
Functional
They are oriented in the relationships that are in the different areas and in the diverse functions that each one of them represents.
Integrals
It is the representation that shows the totality of the different units that are within the company and the relationship that exists between them.
Specific
In these diagrams, the conformation and type of relationship found within a certain area within the company are represented.
General
Organizational charts in this case represent the entirety of an institution, where all hierarchies and their respective relationships to each other are clearly expressed.
Administrative Maso
It shows the representation of different companies that are particularly dedicated to the same style of activity or to the same sector.
Macroadministrative
In these graphs, several entities can be demonstrated at the same time, which means that if a company contains several units, they can be represented in the same diagram.
Microadministrative
This type of scheme has the ability to represent a single company, which can manifest itself in total forms or only demonstrate some of its parts.