Perform a tree diagram it can facilitate decision-making, even in the most difficult cases.
We all must make decisions at different times of our life, work, business, companies, are managed based on decisions that lead to different actions, a wrong decision can generate a great economic loss, waste of resources and even cause a negative impact on the image of the company. business.
Advertisements
The tree diagram is a very useful tool in this decision-making process, we well know that it is not a powerful crystal ball, but provides useful and necessary information to guide you in the right direction.
In this article you will find:
What is meant by a tree diagram?
Advertisements
It is a graphic representation of an experience that consists of multiple steps, where each of these steps has several ways of being carried out.
That is, it is used to determine the calculation of large probabilities when the sample options are known.
Advertisements
This instrument is based on the conditional probability, which assumes that an event A occurs, with knowledge that another event B also occurs. Defined as dependent events, that is, for event A to occur, event B must occur.
Characteristics of a tree diagram
- A tree diagram starts from the general and goes to the specific, that is, the base is the problem and the ramifications are the subsequent levels or causes.
- A tree diagram is useful in grouping construction, whether they are combinations, variations, or permutations.
- It is used in different areas, be it scientific, economic, social, it can even be useful in making decisions on a personal level.
- It facilitates decision making, with the benefit of removing emotions from the equation.
Tree diagram utility
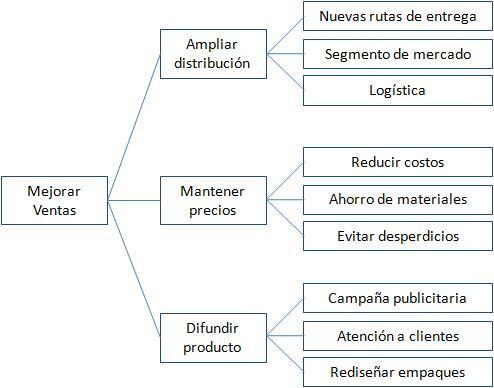
- A tree diagram is very useful in making business decisions, it is used in strategic planning, when studying market research, and when approaching certain conclusions.
- In the world of financing, banks and lenders use this tool to calculate investment risk and opportunities.
- They are very useful in infographics.
- In general, trees are used to evaluate any concern, question and / or visualize the possible results.
- In the world of science, a tree diagram is useful in solving problems of compound experiments, that is, where more than one random experiment is carried out.
- They are a good tool to keep the work team linked to the goals and sub-goals of a task, so that the actions carried out are generally understood.
- It allows highlighting the importance of establishing solutions to the problems detected, in addition to identifying the consequences or possible problems that the proposed solutions would generate. In order to detect the best possible option among the different ones that are presented.
How to create an experimental tree diagram?
In the building a tree diagram It begins by placing a branch for each of the possibilities and is accompanied by its respective probability, these branches are known as first-generation branches.
Advertisements
At the end of each first-generation branch, a node is formed at the same time, from which new ones emerge branches, these are known as second generation branches, according to the number of possibilities in the following He passed. With the exception that the knot represents a possibility of the end of the experiment, that is, the final knot.
It is important to bear in mind that the sum of the probabilities of the branches in each node must give 1. On the other hand, it must be clear that the construction of this diagram does not depend on the existence of the same number of secondary branches starting from each first generation branch.
Advertisements
How to create a decision tree diagram?

A decision tree diagram is characterized by not having too many elements, the key elements are called nodes and are represented by a circle or square, the branches are lines that connect the nodes and other branches until the result is reached wanted.
Square-shaped nodes are used to indicate decisions, and circle-shaped nodes are used to indicate uncertain results.
Each node has branches (minimum two) that develop outwards, in each one of them a possible solution must be written and connected to the next node. You must continue to do this, until you reach the end of all possibilities. Then at the end, a triangle must be drawn, which will represent the result. After the basic design of the decision tree diagram is complete.
Values can be added for each line, in order to provide more knowledge and generate intelligence in the process. You can achieve this by following the steps below:
- Take a good look at each line and add an amount to them.
- The numerical analysis of the options can be developed by adding an estimate to the probability of each result.
Note: When adding percentages, the lines of a node must equal 100; If fractions are used, add 1.
- Attach a possible amount to each triangle at the end of the branches.
- The calculation of the results is carried out by multiplying the result by the percentage of probability assigned to each final branch, from that result the cost of that action is subtracted. You will end up with an estimate of that particular result.
In short, it can be said that a tree diagramconstitutes a graphical method, useful in identifying all the necessary parts in the process of achieving an end goal.
Companies use this method in different processes and procedures, by virtue of which they allow to identify the actions, tasks and decisions that are necessary to develop solutions and improvements in the performance and efficiency of the herself.
In life itself, tree diagrams can be applied, as a tool when choosing, combining or discarding some options that are presented to us before events, eventualities or problems.
You may also be interested in the following topic: Flow chart what is it and what is it used for?