In this article you will find:
Gantt chart
A Gantt chart is a graph of double entry horizontal bars (activities vs time) where each activity is represented by a separate bar and where the beginning and end of the work units and the dependency that exists between are. (See how to make a Gantt chart online)
Modeling of activities as a network
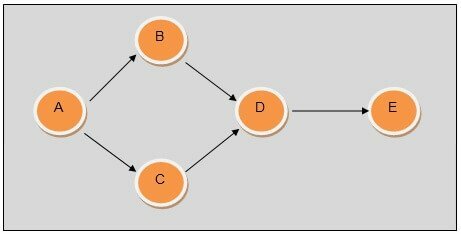
A network is a set of nodes and directed arcs. A node is defined as an activity and an arc indicates the direction to follow in addition to the time it takes from one node to another. Nodes can be defined by capital letters or numbers, either A, B, C or 1, 2, 3... until the total number of activities they represent is completed. This medium is one of the most common to be able to represent a project as a network (Nahmias, 2007).
Advertisements
The critical path is a set of activities that have a dependency relationship that form the longest path in the network, a path that has no slack in its execution times. Any delay in the critical path implies a delay in the total project time.
Advertisements
CPM (Critical Path Method)
The CPM method, which stands for Critical Path Method, was developed by Morgan R. Walter of the E. I. Du Pont de Nemours & Co. James E. Nelly Jr. of the Remington Rand Company for over 50 years. This project planning and control tool is composed of a set of arcs and nodes that graph the dependency between activities. The CPM deals with purely deterministic problems since the time of the activities is known. Due to the above, the critical path is clear and well defined.
PERT (Program Evaluation and Review Technique)
PERT is a project management and administration model that stands for Program Evaluation and Review Technique. Invented in 1958 by the US Department of Defense Office of Naval Special Projects as part of the Polaris mobile ballistic missile project launched from submarine. This project planning and control tool composed of a set of arcs and nodes that graph the dependency between activities. The PERT method deals with measuring the time of the activities when it is not clearly determined, it allows the randomness of the times. This means that when it is not clear how long an activity takes, 3 times are taken, a minimum time, a maximum time and the most probable time to approximate the duration of the activity.
Advertisements