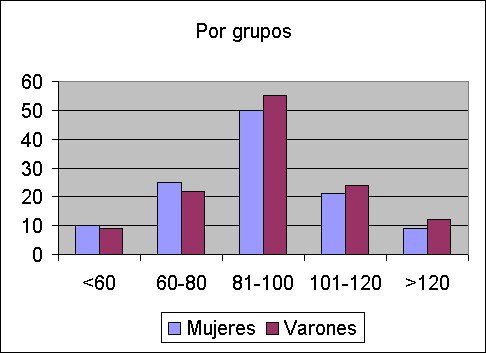
Statistically, the histogram is a useful tool that facilitates the understanding of numerical data difficult to understand, under the possibility of establishing an orderly and understandable image.
In this article you will find:
What is meant by histogram?
A histogramis the graphical representation in the form of bars, which symbolizes the distribution of a data set. In general, this tool is used by statistics, its function is the graphic display of numbers, variables and figures, for an orderly and clearer display.
Advertisements
Due to the type of information and the way in which it is available, it is thought that they are especially useful in social sciences, allowing the comparison of data in censuses, sex, literacy, birth, death, etc.
In general, they serve to provide a view or panorama of the distribution of a sample, in relation to a certain quantitative characteristic, allowing to observe the preference by part of the same, evidencing behaviors, homogeneity or agreement between the various values of the parts that make up the sample, or in contrast, noting the degree of dispersion of the values.
Advertisements
How do you make a histogram?

This representation is always in the form of bars, the extension of each of the bars is proportional to the continuity of the values it represents.
Advertisements
The horizontal axis represents the values of the variables from lowest to highest and the vertical axis incorporates the frequencies, class marks are usually indicated, that is, the mean of the grouping interval of the data, known as frequency relative.
In order to properly construct a histogram it is necessary to previously carry out the construction of a frequency table.
Advertisements
The bars are drawn with the same width and proportional to the interval, the height will be given by the absolute frequency. These bars are drawn adjacent, one next to the other, without intersecting each other, that is, the bars touch the bars on their sides, unless there is a zero frequency interval.
Today there are statistical application software, which facilitate the construction of these histograms, so we must focus on their interpretation. However, they can still be done manually with the use of some appropriate tools.
Advertisements
What are histograms used for?
The histograms are helpful in order to:
- Interpret in a simple way the variation of the data.
- Provide a clear view of the information provided by the data, facilitating their interpretation.
- Compare values and identify possible causes of a problem.
- Check the causes.
- Assess possible solutions, once the causes of the problem have been eliminated.
Characteristics of a histogram
- Shows the distribution of a data set.
- Vertical bar graph
- It shows a bar attached to another bar, with no space between them.
- Each bar constitutes a subset of the data.
- It figures the accumulation or trend, variability or dispersion and distribution of a sample.
- It is used to represent continuous variables and discrete variables.
- The data is grouped into classes, these are intervals of the same size.
Histogram types
There are different types of graphic representations of these, the most common are:
Simple bar histograms
They represent the simple frequency, either absolute or relative, through the height set to the bar, which must be proportional to the frequency of the class it represents.
Composite bar histogram
It is used in the representation of 2 variables, which are shown according to the simple frequency of the variable mode and its height is proportional to it.
Clustered bar histogram
It is used in the representation of information of two variables, where by means of a set of bars they represent the different modalities.
Frequency polygon
It is a graphical representation of lines that is used to show the absolute frequencies of all the values in a distribution, where it can be observed that the height of the point attached to the value of a variable is proportional to the regularity of said value.
Percentage warhead
It is a cumulative graphical representation, useful when the representation of the percentage class of each value in the frequency distribution is pursued.
Interpretation of a Histogram
Assessment of key characteristics
In this step, the peaks and dispersion in the distribution must be examined in detail. Evaluating how the sample size might affect the final appearance of the histogram.
Search for unusual data indicators
Commonly skewed and multimodal data indicate abnormality in the data, outliers could indicate other types of conditions in the data.
When there are skewed data, the data are mostly located in the lower or upper part of the graph, this asymmetry indicates that said data may be abnormally distributed.
Outliers are values that are far from other values and can significantly affect the results.
Evaluating the fit in a distribution
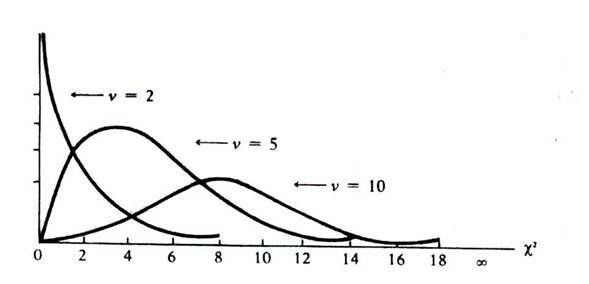
It occurs in cases where the histogram shows a very tight distribution line, so it must be evaluated how close the heights of the bars and the shape of the line are.
If these bars go close to the distribution line, then the data must fit the distribution properly.
Evaluation and comparison of the groups
In case the histogram has groups of data, the center and dispersion of these groups must be compared and evaluated.
Looking for the differences between the centers and the dispersions of the groups.
In conclusion it is worth mentioning that thehistogram is considered a graphic compendium of the values derived from the variations of a given characteristic, representing the frequency with which different categories are shown among said set.
The main purpose of the analysis and interpretation of Histograms in statistics is to identify and classify a variation model in the studied data set and carry out a relevant and admissible explanation for said model, where the variation is related to the phenomenon in study. The result of said analysis constitutes a possible theory about the process or the cause of the problem being studied and facilitates the search for possible solutions.

