The normal distribution it is the most important probability distribution in statistics, known for the number of phenomena it explains. It is called Gaussian bell, since when representing its probabilistic function, it has the shape of a bell.
It is the most frequently used in applications statistics, due to its extensive use, supported by the frequency with which some phenomena tend to resemble their.
Advertisements
To be precise regarding its use, reference can be made to the origin of its own name, which comes from fact that for a long time physicians and biologists believed that all natural variables of interest followed this model.
In this article you will find:
Importance of the normal distribution
It is the most important continuous model in statistics due to the following reasons:
Advertisements
- Its application is direct and allows observing many variables of interest, which can be easily described with this model.
- It serves to approach several discrete probability distributions, including the Poisson distribution and the Binomial distribution.
- Its properties have allowed the development of many statistical inference techniques. Providing the foundation for classical inferential statistics, for its relationship with the central limit theorem.
When is a distribution normal?
The Gaussian distribution or normal distribution is the distribution continues that we generally use in the area of statistics. … It has the objective of close to various discrete probability distributions, as is the case with the distributionPoisson and the distribution binomial.
Fundamental concepts in the normal distribution
To understand and work properly with the normal distribution in statistics, it is necessary to know and be clear about certain concepts on which this model is based.
Advertisements
Continuous Random Variable
It is one that achieves an infinite number of values within a certain range. For example, the weight of a person based on the accuracy of the scale can be 80.5, 80.52, etc.
See more of the continuous random variables here.
Advertisements

Normal probability distribution
Many random variables follow a normal distribution or close to it. Well, its most outstanding characteristic is that the great majority of the probability distribution, whether discrete or continuous, can be approximated with a normal probability under certain conditions.
Advertisements
The characteristics of both the normal probability distribution and the curve that represents it are:
- The curve is bell-shaped with a peak in the center of the distribution. So the arithmetic mean, mode and median are equal and are located at the peak.
- It is symmetrical around its mean. Half of the area under the curve is to the right of this center point and the other half is to the left.
- The curve slopes slightly in both directions from the central value.
- It is asymptotic, that is, the curve is quite close to the X axis but does not touch it.
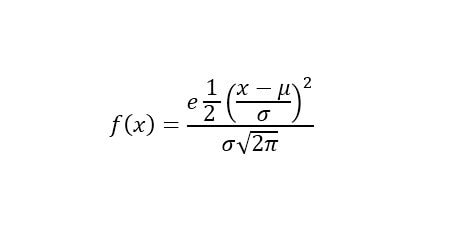 Probability density function
It employs laborious calculations, it can be demonstrated by applying the formula is
Said density function:
- You can use any value (- ∞, + ∞)
- Values close to the center point (mean) are more likely.
- As you move away from the µ value, the probability decreases in the same way to the right and left (symmetric).
- As you move away from the µ value, the probability decreases more or less quickly depending on the standard deviation (parameter s).

Use of distribution in statistical deduction
The concepts of probability and sample distributions are used as an introduction to the Statistical Inference method, which is composed of:
- Estimation: Which seeks to evaluate the parameters of the population based on a sample.
- Hypothesis tests: Process related to the acceptance or rejection of any statement about the parameters of the population.
When making measurements of any kind and distributing the results under some criteria, it is very common to find that the data are grouped in a singular way, in Sometimes these distributions follow a form with a greater number of observations for a given value, decreasing the observations on both sides of this more frequent.
The use of this distribution is found in various branches of knowledge, it is applied to a wide variety of observations in biology, astronomy, geography and economics.
Many phenomena in nature can be approximated with a normal distribution. In general, it can be reviewed as a result of the interaction of many random effects on the variable under study.
In this type of distribution, you can calculate the possibility that a few events will occur within certain intervals or ranges, however, the exact probability of a value within a continuous distribution, such as the normal distribution, is equal to zero (0). This property differentiates continuous variables, which are measured, from discrete variables, which are counted.
For example, time (in seconds, minutes, or hours) is measured, not counted. So it is a feasible variable to determine. The probability that the installation time of a certain utility stops on a computer is between 8 and 15 seconds or the probability can be between 8 and 9 seconds. However, the probability that the installation time is exactly 9 seconds is zero.


