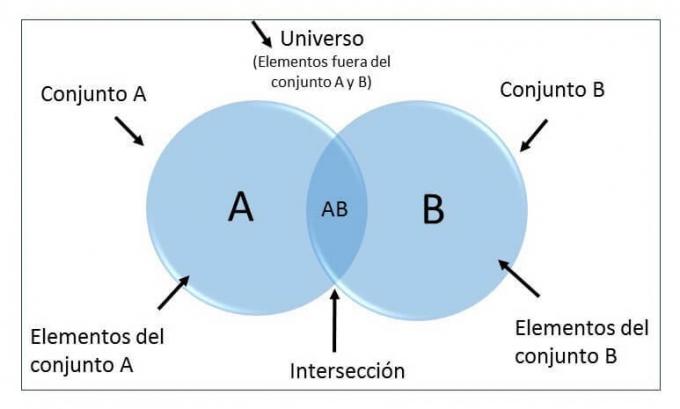
Before exemplifying the Venn diagram, let's define what this diagram is.
A Venn diagram is called a diagram in which circles overlapping other circles are used to represent the relationship between elements of different sets.
Advertisements
This graphical representation allows to visualize the elements, characteristics or qualities that each set hasWhen some elements of a circle have characteristics in common with the elements of another circle, they are superimposed one on the other.
This superposition of the circumferences or circles is known as intersectedn, which is nothing more than the union of both to represent the elements that share in common and the elements that are outside the two sets is known as universe.
Advertisements
This universe is made up of all those elements that are not representative of any of the sets.
Advertisements
To get a better interpretation of the Venn diagram, let's look at the following examples:
In this article you will find:
Venn diagram example 1
We want to make a graphical representation to establish the relationship that exists between elements of the set (A) made up of triangles and elements of the set (B) made up of circles.
Advertisements
The sets are represented by elements of different colors, you want to visualize the relationship between the two groups.
Representative graph:
Advertisements
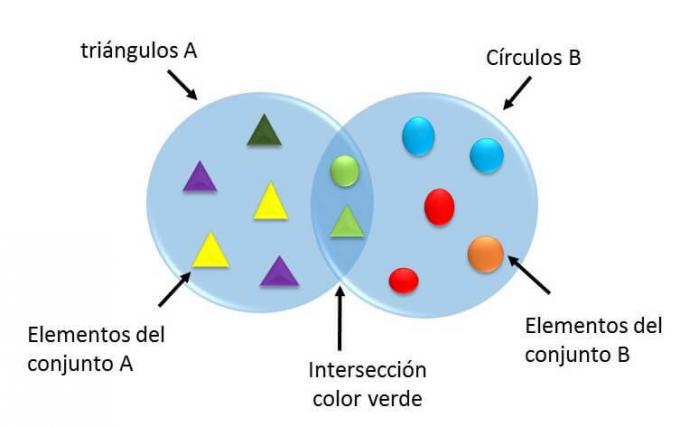
In this graphic representation it can be seen that in the intersection of both sets the only quality that both have in common only the color green, that is to say that even when these groups are represented by different elements there is a quality that makes them relate.
Venn diagrams are very useful to represent the relationships that exist between elements of different sets, however, its application is not only limited to representing relationships between two clusters, Venn diagram can be used to represent 2,3,4,5,6 or more sets.
Each intersection of the clusters represents a different area, in two-set diagrams, only three areas can be visualized, those of the two sets and the area of intersection.
Venn diagram example 2
You want to make a representation in a Venn diagram to visualize the relationship between oviparous animals, walking animals and swimming animals.
Set A: represented by oviparous animals, that is, those that lay eggs.
Set B: represents the animals that walk.
Set C: composed of animals that swim.

As can be seen in the diagram the intersection between set A and set B, establishes that in the two sets there is an animal in common, which in addition to being oviparous it's an animal who walks.
In the intersection of set B with set C, it can be seen that there is a common animal among the sets that can adapt to both water and land conditions.
And in the intercession between sets C and A, it can be seen that the fish is an animal that In addition to being able to swim, it is an oviparous animal.
However, the Venn diagram, not only allows relationship two sets, (AB), (BC) AND (CA), but also each grouping of elements may have qualities shared with each other, whose intersection encompasses the sets (ABC).
That is, you can see that the crocodile shares qualities of all three groups, this being a oviparous animal that walks and also knows how to swim.
In this sense the diagrams of three sets can be observed, seven representative areas, which are the three sets, the three intersections and an additional area formed by the union of the three intersections.
Venn diagram example 3
The Venn diagrams have the benefit of allow information to be assimilated more quickly through a visual representation, even before more complex problems, where each of the circles can be given the connotation that you want to represent.
Once you have established what you want to represent in each of the sets, it only remains to establish the intersections between them, in this case we can visualize the following diagram:

As can be seen, the sets that make up a Venn diagram can be used to represent different elements in representation of a given set.
What generally characterizes a Venn diagram is its quality or ease of representing through the intersection of the circles the conditions that the sets have in common, in in this case the relationship between commercial law, administration and accounting.
These three sets represent important areas for the functioning of an economic entity, although each one has its own functionalities in said organization.
Therefore, the Venn diagram is a useful tool if you want to transmit information in a way that reaches a target audience faster or interpreter.