perform a tree diagram can facilitate decision making, even in the most difficult cases.
We all must make decisions at different times of our lives, work, business, companies, are handled in based on decisions that lead different actions, one wrong decision It can generate a great economic loss, waste of resources and even cause a negative impact on the image of the company.
Advertisements
The tree diagram is a very useful tool in this decision-making process, we know that it is not a powerful crystal ball, but provides useful and necessary information to guide you in the right direction.

Advertisements
Is a graphic representation of an experience that consists of multiple steps, where each of these steps has several ways of being carried out.
That is, it is used for determine the calculation of probabilities when the sample options are known.
Advertisements
This tool is based on conditional probability, «which assumes that an event A occurs, with the knowledge that another event B also occurs.
In this article you will find:
Characteristics of a tree diagram
- It is very useful in the formation of grouping that is related to variations, permutations or combinations.
- Optimize decision making where emotions are avoided in the equation.
- It is a method that starts from the general to the specific, which means that the problem is the base and the different causes or subsequent levels are the ramifications.
- It can be used in various fields, such as economic, scientific and personal.
Tree Diagram Utility
- A tree diagram is very useful in making business decisions, it is used in strategic planning, when studying market research, and when addressing certain conclusions.
- In the world of financing, banks and lenders use this tool to calculate investment risk and opportunities.
- They are very useful in infographics to explain concepts and the path of the best decision.
- Trees are generally used to assess any concerns, questions and/or visualize possible outcomes.
- In the world of science, a tree diagram is useful in solving problems of compound experiments, that is, where more than one random experiment is carried out.
- They are a good tool to keep the work team linked to the goals and sub-goals of a task, so that the actions carried out are generally understood.
- It allows highlighting the importance of establishing solutions to the problems detected, in addition to identifying the consequences or possible problems that the proposed solutions would generate. In order to detect the best possible option among the different ones that are presented.
Advantages of a tree diagram
Among the advantages that this favorable tool of great utility includes are:
Advertisements
- Since it is a graphic method, it is determined as a visual element, which indicates that it can show the relationship that the levels have in general as concepts and components.
- Has the ability to find the cause of the situation or problem posed.
- It provides information that can lead the media in the right direction.
- It can cover a wide number and variety of situations related to projects, goals, problems or objectives.
- It is perfect for making the right decisions.
Both at a personal and business level, this method is used to be able to classify, list, choose and identify events, problems and endless actions with the intention of improving the solutions. This indicates, that a tree diagram It is very useful to know how to identify the parts that a process requires to obtain the final result or objective.
How to create an experimental tree diagram?
Step 1
In the building a tree diagram It begins by placing a branch for each of the possibilities and is accompanied by its respective probability, these branches are known as first generation branches.
Advertisements
Step 2
At the end of each branch of the first generation, a node is formed at the same time, from which new ones come out. branches, these are known as second-generation branches, depending on the number of possibilities in the next step. With the exception that the knot represents a possibility of the end of the experiment, that is, the final knot.
Considerations
It is important to take into consideration that the sum of the probabilities of the branches in each node must give 1. On the other hand, it should be clear that the construction of this diagram in no case depends on there being the same number of secondary branches starting from each first generation branch.
How to create a decision tree diagram?
A decision tree diagram is characterized by not having too many elements, the key elements are called nodes and are represented with a circle or a square, the branches are lines that connect the nodes and other branches until reaching the result wanted.
Step 1
Square nodes are used to indicate decisions, and circle nodes are used to indicate uncertain outcomes.
Step 2
Each node has branches (minimum two) that develop outwards, in each of them a possible solution must be written and connected to the next node. You must continue to do this, until you reach the end of all possibilities. Then at the end, a triangle must be drawn, which will represent the result. Once the basic design of the decision tree diagram.
Step 3
Values can be added for each line, in order to provide more knowledge and generate intelligence in the process. You can achieve this by following these steps:
- Take a good look at each line and add an amount to them.
- Numerical analysis of the options can be developed by adding an estimate to the probability of each outcome.
Note: When adding percentages, the lines of a node must equal 100; if fractions are used, add 1.
- Attach a possible amount to each triangle located at the end of the branches.
- The calculation of the results is carried out by multiplying the result by the probability percentage assigned to each final branch, subtracting the cost of that action from that result. You will end up with an estimate of that particular outcome.
In summary, it can be said that a tree diagramconstitutes a graphical method, useful in identifying all the necessary parts in the process of achieving an end goal.
Companies use this method in different processes and procedures, by virtue of the fact that they allow identifying the actions, tasks and decisions that are necessary to develop solutions and improvements in the performance and efficiency of the same.
Tree diagrams can be applied in life itself, as a tool when choosing, combining or discarding some options that are presented to us in the face of events, eventualities or problems.
You may also be interested in the following topic: Flowchart What is it and what is it used for?
Examples of a tree diagram
This method is represented graphically and is used in order to list all the results necessary from varied experiments, where each one can come from a number of definite forms. Some examples of tree diagram are:
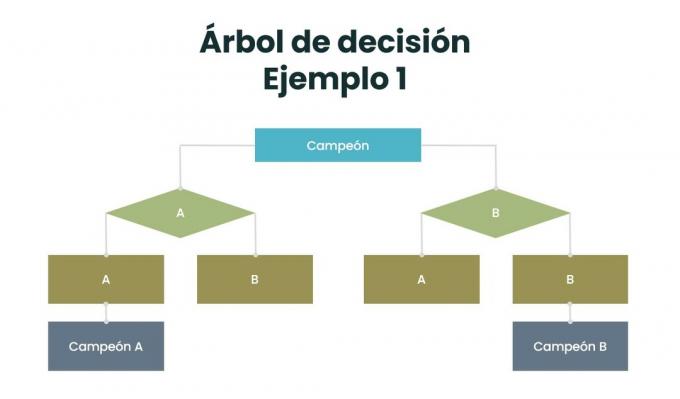
Example 1
Two teams that are classified as A and B play the final of a football match, the team that achieves victory in two consecutive matches will win the championship. Through the tree diagram it will be possible to reflect how the victory of the tournament can be obtained.
- Solution:
A = Team A wins
B = Team B wins
The model can show several ways to win the tournament and it is possible to know this by counting the terminal branches of the diagram. Some ways to list them are: AA, ABB, BB, BAA, among others. Clearly the list in this example can get a bit bigger if the tree keeps branching.
Example 2
Carlos and Luís participate in a chess tournament, where the winner of the tournament will be the one who obtains two games in a row won or finish three games What is the number of various ways how can the game turn out? tournament?
- Solution:
- 8
- 9
- 10
- 7
C and L will be taken into account as the games won by Carlos and Luís individually in each play. The diagram comprises 10 final points corresponding to the tournament where the following results are shown and the answer is C: RR, RCRCR, RCC, CRCRC, CC, RCRR, RCRCC, CRR, CRCC, CRCRR.
Example 3
Alejandro has the opportunity to play roulette only five times, he will start the game with €1 and in each play he will also bet €1, which he can win or lose in every chance, he has to fold once he loses all the money, but if he wins €3 or completes all five games, how many ways are there for the game to be played? Alexander?
- Solution:
If the terminal branches of the diagram are counted, it will be seen that there are 11 variants as Alejandro made his bets and the representation of the five games that this individual could play.
Example 4
A doctor lists his patients according to their blood type, gender, and blood pressure. By means of the diagram, in how many enumerations are the patients of this doctor?
- Solution:
By counting all the terminal branches, it can be determined that the numberings are 2 x 4 x 3 = 24, being the same as those listed as: MAA, MBN, MBB, MAN, MAB, MBA, among others.
Example 5
In example 5, you can highlight a tree diagram that has to do with the options to carry out a company's marketing plan.
It can be seen that the company has two main alternatives, either they carry out the marketing plan through outsourcing or with resources from the company itself.