Statistical analysis is essential in research to discover trends and patterns in data. Through meticulous steps, from defining objectives to presenting findings, it allows us to make informed decisions and enrich our knowledge of the world around us.
In the information age, the statistic analysis It has become an indispensable tool to understand the world around us. If you've ever wondered how companies predict trends, how researchers discover patterns in large sets of data or how survey results are interpreted, you are in the right place. Join us on this educational and informative journey to discover the advantages and applications of statistical analysis.
Advertisements
In this article you will find:
What is Statistical Analysis?
Statistical analysis is the heart of

Data Analysis in Statistics
Statistics is the art and science of learning from data. He analysis of data In statistics it involves examining data sets to discover the underlying information. This can include identifying correlations, analyzing variations, testing hypotheses, and much more. It's like being a detective, but instead of solving crimes, you're uncovering stories and truths hidden in data.
In What Situations to Use Statistical Analysis
Statistical analysis is versatile and can be applied in a wide variety of situations, such as:
- Scientific investigation: To test hypotheses and validate experiments.
- Business: To predict market trends, optimize operations and understand consumer behavior.
- Medicine: In clinical trials to evaluate the effectiveness of a new medication.
- Economy: To analyze economic behavior and predict future trends.
- Government: In data-based policy formulation and decision making.
Steps to Perform a Statistical Analysis in Research
Conducting statistical analysis is a meticulous process that requires attention to detail and a clear understanding of the research objective. Below, we break down each step so you can understand and apply this process effectively:
-
Clear Objective:
- How to start: Before diving into the data, it is essential to have a clear research question or hypothesis.
- Development: Reflect on what you really want to discover or try. Are you looking for a specific correlation, testing a new theory, or identifying an emerging trend?
- Tools: Use research design programs or planning templates to outline your objective and maintain focus.
-
Data Collection:
- How to start: Define your target population and decide how you are going to obtain the data (surveys, experiments, existing databases).
- Development: Make sure data collection is systematic and unbiased. If you conduct surveys, ensure that the questions are clear and do not lead to answers.
- Tools: Online survey platforms such as SurveyMonkey, academic databases, experimentation software, among others.
-
Organization:
- How to start: Once you have your data, it is essential to organize it in a way that facilitates analysis.
- Development: Classifies and orders data according to variables, times, groups, etc. Clean up any erroneous or irrelevant data.
- Tools: Spreadsheets such as Excel, statistical software such as SPSS or R to manage and organize large data sets.
-
Application of Statistical Models:
- How to start: Based on your objective, select the appropriate statistical model.
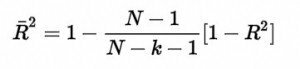
- Development: Apply the model to your data. This may include regression analysis to identify relationships, t tests to compare groups, or analysis of variance to compare more than two groups.
- Tools: Software such as R, SPSS, SAS or Python with statistical libraries to apply and visualize models.
-
Interpretation of results:
- How to start: Once you have the results, it's time to interpret them in the context of your research.
- Development: Analyze whether the results confirm or refute your hypothesis. Reflect on any surprises or unexpected findings and what they might mean.
- Tools: Graphs and tables to visualize results, analysis software to delve deeper into the data.
-
Presentation:
- How to start: Think about your audience. Who are you presenting the findings to? What level of detail do they need?
- Development: Create a presentation that is clear and concise. Use graphs, tables, and other visual resources to make your analysis understandable.
- Tools: Presentation programs such as PowerPoint or Keynote, data visualization tools such as Tableau or infogram.
With these detailed steps, you are well equipped to embark on the fascinating journey of statistical analysis. It is a process that, although it may seem challenging at first, offers significant rewards in terms of knowledge and discoveries.
Recommended tools or software
- SPSS (Statistical Package for the Social Sciences): Software widely used in social and business sciences for statistical analysis.
- A: Programming language and free software for statistical analysis and graphics.
- SAS (Statistical Analysis System): Advanced analysis software, used in various industries.
- MATLAB: Mathematical calculation platform that includes statistical tools.
- Excel: Although it is a spreadsheet, it has basic statistical analysis tools.
- Stata: Software that combines statistics, graphics and data management.
- Python (with libraries like Pandas, NumPy and SciPy): Programming language with specific libraries for statistical and data analysis.
- Minitab: Statistical software used for quality analysis and Six Sigma.
- Tableau: Data visualization tool that also offers some statistical capabilities.
Statistical Techniques
- Descriptive statistics: It includes measures of central tendency (mean, median, mode) and dispersion (variance, standard deviation).
- Regression Analysis: Study the relationship between variables. It can be linear, logistic, multiple, among others.
- Analysis of Variance (ANOVA): Compare the means of three or more groups.
- Student's t tests: Compare the means of two groups.
- Chi squared: Evaluates the association between categorical variables.
- Correlation: Measures the linear relationship between two variables.
- Factorial analysis: Reduce the dimensionality of data by identifying underlying factors.
- Principal Component Analysis (PCA): Dimensionality reduction technique.
- Cluster Analysis: Group similar objects into clusters or groups.
- Non-Parametric Tests: Used when the data does not meet normality assumptions (e.g. Mann-Whitney test, Kruskal-Wallis).
- Time Series Analysis: Analyze data over time to identify trends or cycles.
These tools and techniques are just a sample of what is available in the field of statistics. Choosing the right tool or technique will depend on the type of data you are working with and the specific objective of your analysis.
How to graphically represent the Data?
Graphic representation is an essential part of the statistic analysis, since it facilitates the understanding and visualization of the data and results. Here I present some of the most common forms of graphical representation in statistics:
- Histogram: It represents the frequency distribution of a data set. It is especially useful for visualizing the shape of the data distribution.
- Bar chart: Used to compare quantities of different categories. The bars can be horizontal or vertical.
- Pie (or Circular) Diagram: Represents proportions or percentages between categories in a data set.
- Scatterplot: It shows the relationship between two quantitative variables, allowing correlations or trends to be identified.
- Boxplot: Represents the distribution of a data set across its quartiles, showing the median, minimum and maximum values, and possible outliers.
- Stem and Leaf Diagram: It represents quantitative data in groups, separating each value into a “stem” and a “leaf.”
- Line Chart: Primarily used for time series, it shows how a variable changes over time.
- Area Chart: Similar to the line graph, but with the area under the line filled in, highlighting the magnitude.
- Radial or Radar Chart: It represents multiple quantitative variables on axes that start from a central point, useful for comparing profiles or characteristics.
- Point Diagram: Shows the frequency of data in points along an axis.
- Pareto Chart: Bar diagram that orders the categories from highest to lowest frequency, useful for identifying the most significant factors in a data set.
- Q-Q (Quantile-Quantile) Chart: Compare two probability distributions by plotting their quantiles against each other.
These graphical representations, when used appropriately, can offer valuable interpretations of the data. It is essential to choose the type of graph that best suits the nature of the data and the objective of the analysis.
Conclusion
He statistic analysis It is a powerful tool in the world of investigation. It allows us to discover trends, identify patterns and make informed decisions. By understanding and applying statistics in our research, we not only improve the quality of our findings, but also enrich our knowledge of the world around us.