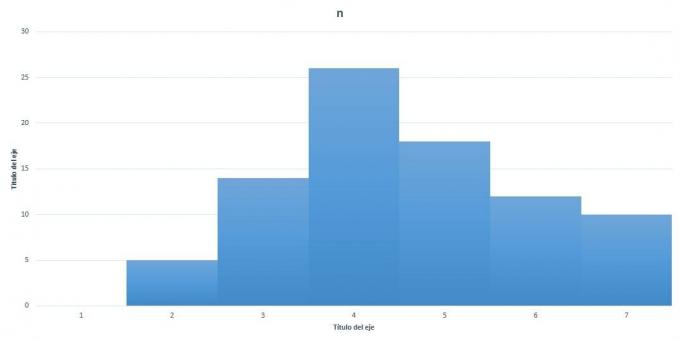
A frequency polygon is the name of the type of graph that is made from a frequency histogram, in which vertical columns are used to express the frequencies, the polygon is created by joining the points of maximum height within these columns.
This graph is the one that can be established from the union of different midpoints of the columns that form the configuration of what we know as frequency histogram. The polygon is characterized by using vertical columns all the time and by never leave space between one column and another.
Advertisements
Within the social sciences, natural sciences and economics, it is where it is most frequently used these histograms, since they are used to be able to carry out all kinds of comparison on the results of a certain process.

Advertisements
In this article you will find:
Frequency polygon target
- This type of chart is specifically designed for compare two sets of data. It can be used when you want to make a representation of a number of different distributions or also a cross classification of a qualitative continuous variable with a quantitative or one that is quantitative that is discreet in the same drawing.
- Another objective of the frequency polygon is to graphically show a cumulative frequency, although it is not part of its characteristics, on rare occasions it can be watch.
- The point that has the greatest height within this type of graph usually has the maximum frequency, while in the part that is below the curvature it contains the existence of all the data.
- It is very important to remember that every frequency is the greater or lesser repetition of a certain event. or in the same way it is the number of times that a periodic event is repeated in a unit temporary.
- Due to the usefulness and value of these polygons, it can be highlighted that they have the ability to be done quickly and easily. In general, they can be created by means of a computer program such as Excel, the software that today has become an axis that benefits all the processes of any type of company.
Frequency polygon characteristics
Within this type of graph, a series of outstanding characteristics are generated that will be mentioned below:
Advertisements
- No accumulated frequency of any kind is shown within the graph.
- They can be used mostly for various quantitative data.
- The point that has the greatest height is the one that represents the one that contains much more frequency.
- They can be used to represent type B tables.
- The area under the curvature represents all the data.
- It is a graph that is obtained from the union of segments consistently by means of points that interact between the midpoints of each one of the classes and its respective frequency, where the midpoint before the first class and the midpoint after the last class are involved.
- In the same way, it can be obtained when the midpoints of each of the classes that are placed on top of all the rectangles found in the histogram are joined.
Procedure for constructing a frequency polygon
This model of a closed linear graph is formed when all the midpoints of each of the elements are consequently joined with their respective frequency, which gives similarity to the creating a histogram. To do this, follow the steps shown below:
Step 1
The first thing to do is collect information on what is going to be studied quantitatively so that calculations can be made easier.
Advertisements
Step 2
Then the lower and upper limits are made or established for all types of elements that are being studied.
Step 3
Determine the frequency of each type of element that is within the limits that are established in the second part.
Advertisements
Step 4
Then the calculation of the average of the limits is made.
Step # 5
Finally, the closed linear graph is made, with all the data that have been obtained.
Presentation rules for a frequency polygon
Among the most important standards are:
- The abscissa or X axis must represent the values of all the classes that are grouped in the variable of interest.
- On the ordinate axis or Y axis you have to put the relative or absolute frequency that corresponds to the various classes that are going to be represented.
- Each point has as its base, the abscissa axis and the corresponding height is direct and proportional to the magnitude of its frequency.
- The line to be drawn has to be closed at the ends. In order to do this, a class before the first and a class after the last must be assumed, and a cut must be made on the X axis in half of these imaginary classes.
- In case the classes have different interval sizes, an adjusted frequency or frequency density calculation is performed. All this in order that the scale of the abscissa axis correctly represents the difference in the magnitude of the types of classes.